Dashboard user guide
This is a user guide for those accessing the dashboards generated by this software. The data are intended to be accessed via the dashboards, which also provides images in standard formats, metadata about where the data came from and what processing was applied.
Basic navigation
The basic aim of the dashboards is to share data used in the State of the Global Climate report, as well as regional datasets derived from the same sources. The dashboard provides images, text and data that can be used as the basis for writing monitoring reports.
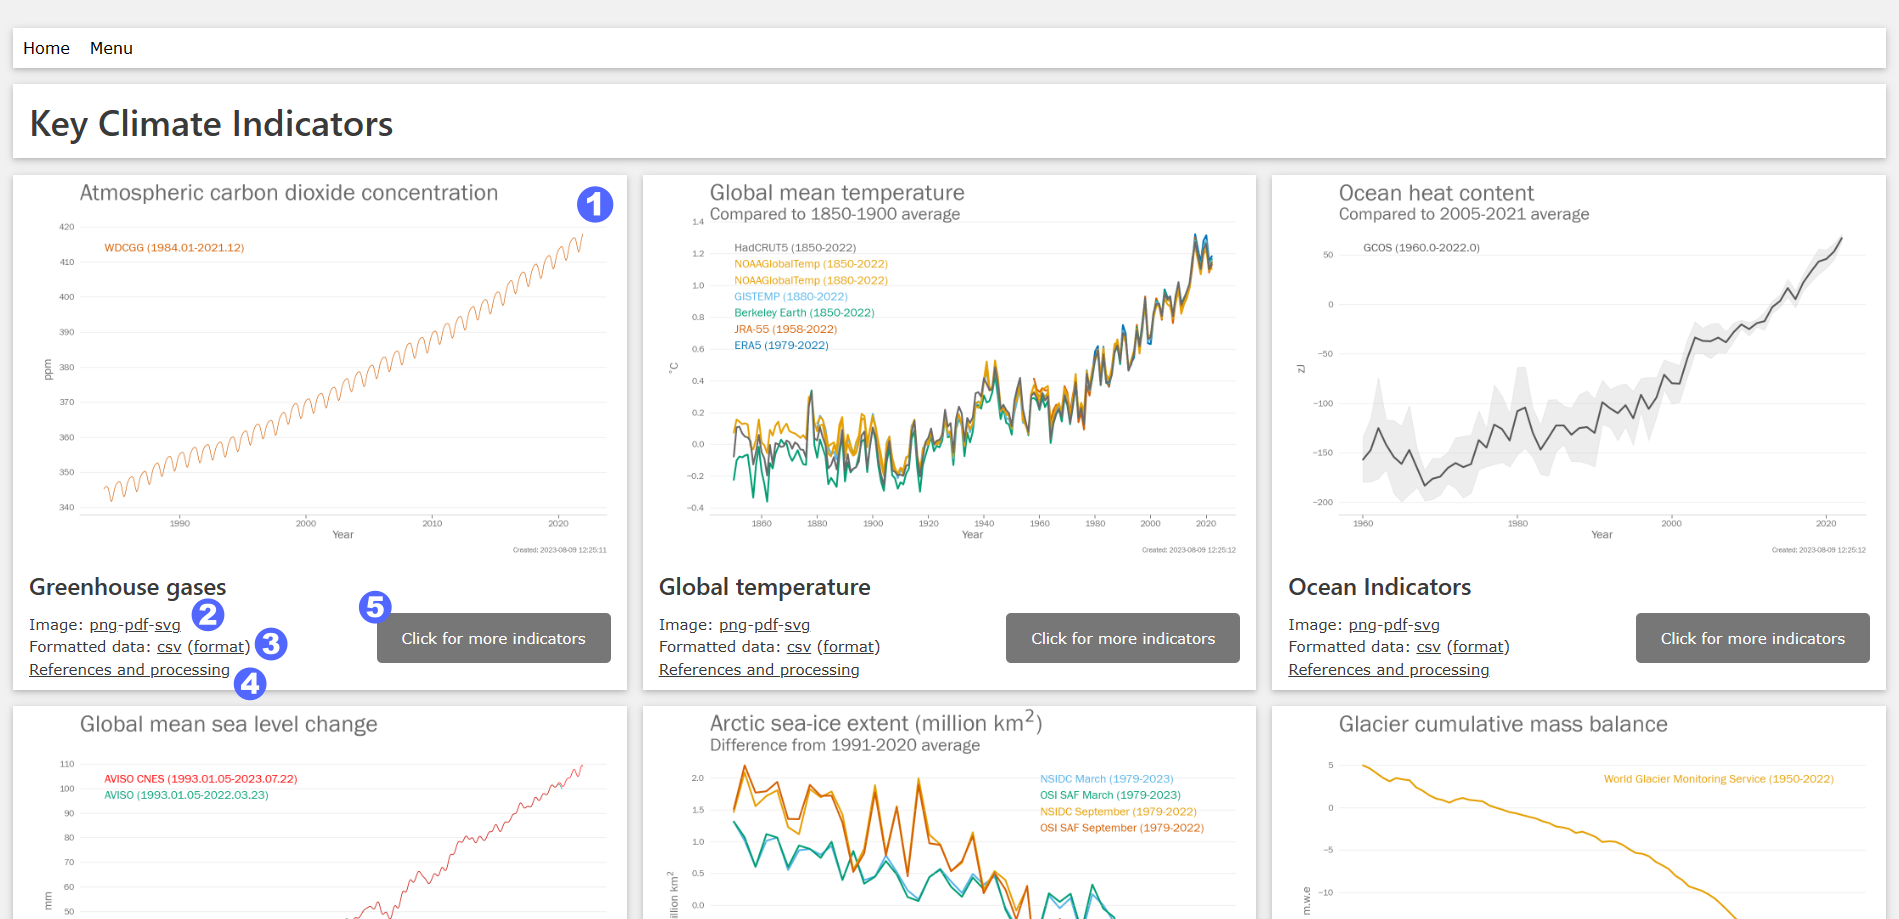
Screenshot indicating the important elements of the dashboard
The dashboard is split up into individual cards. Each card has the following elements which are numbered in the image above:
A main image with an appropriate title
Links to the main image in different formats: png, svg and pdf. The last two of these are vector formats, so suitable for publication and editing.
A link to a zip file containing the datasets shown in the image. Clicking on the link will download the zip file. There is also a link to a webppage describing the data format. Each file in the zip archive is a csv file, and can be opened in Excel.
A link to “references and processing”. The link takes you further down the page to a description of the indicator and other important information, including a link to the original data source, the correct citation, and details of the processing applied to each data set.
On the main dashboard there is button marked “Click for more indicators”. Clicking the button takes you to a set of related indicators.
Below the main set of images, there are three sections
Introduction - explaining the contents of the page
Key messages - a set of short texts for some or all of the key indicators, automatically generated from the data.
Dataset and processing details - details of what data sets were used and the processing applied.
More detail on some of these elements is given below. The final element on the page indicates when the page was created and what version of the software was used to do so.
Image formats
The main images are available in three formats:
png - Portable Network Graphics format. The images are relatively high resolution (1370 x 900 pixels) so should work well in most situations. The downside is that the file sizes are relatively large.
svg - Scalable Vector Graphics format. This is a vector format, so the images can be scaled and zoomed without loss of quality. As such, they are ideal for use in publications.
pdf - Portabl Document Format. This is a vector format, so the images can be scaled and zoomed without loss of quality. As such, they are ideal for use in publications.
Data format
The data for each indicator are stored in zip files. These can be opened in windows by right clicking and selecting “Extract all”. When extracted, you get a directory containing one or more csv files (Comma Separated Value). Csv files can be read by most data handling programs, including Excel. The csv files conform to the BADC CSV standard (https://help.ceda.ac.uk/article/105-badc-csv). Each csv file contains a header with metadata followed by the data itself.
The metadata includes:
the convention (BADC-CSV version 1) that is used to structure the file
title
the date of the last revision
the date of validity (set to be the same as that of the last revision)
feature type, which describes what the data represents
creator, set in the code to be WMO
source, gives the name and version of the software used to generate the file
observation_station, set to “derived data”
location, gives the latitude and longitude bounds of the data
activity, provides a name for the activity that generated the data
history, details the processing steps that have been applied to the data
reference, a citation for the dataset
rights, not filled
comments, additional comments on the data
Then for each variable in the file, there are a number of components, which specify what they represent
long_name, a description of the variable and its units
type, whether data are an integer (int) or floating point number (float)
One of the variables is marked as a “coordinate variable”
The data themselves appear after the word “data” in the left-most column. There is one data column for each variable described by a long_name and type. Data continue until the “end data” marker in the left-most column.
References and processing
The section on “references and processing” for each indicator includes the following:
a short description of the indicator
a link to the data file (which is as described above)
a checksum for the data file
a link to the data format
- a list of data sets used in the indicator including the following information:
a link to the original data file if it is available online
a citation for the original data file either to a journal article, a data citation, or both
a list of the processing steps applied to the original data file to produce the indicator.