Key Climate Indicators
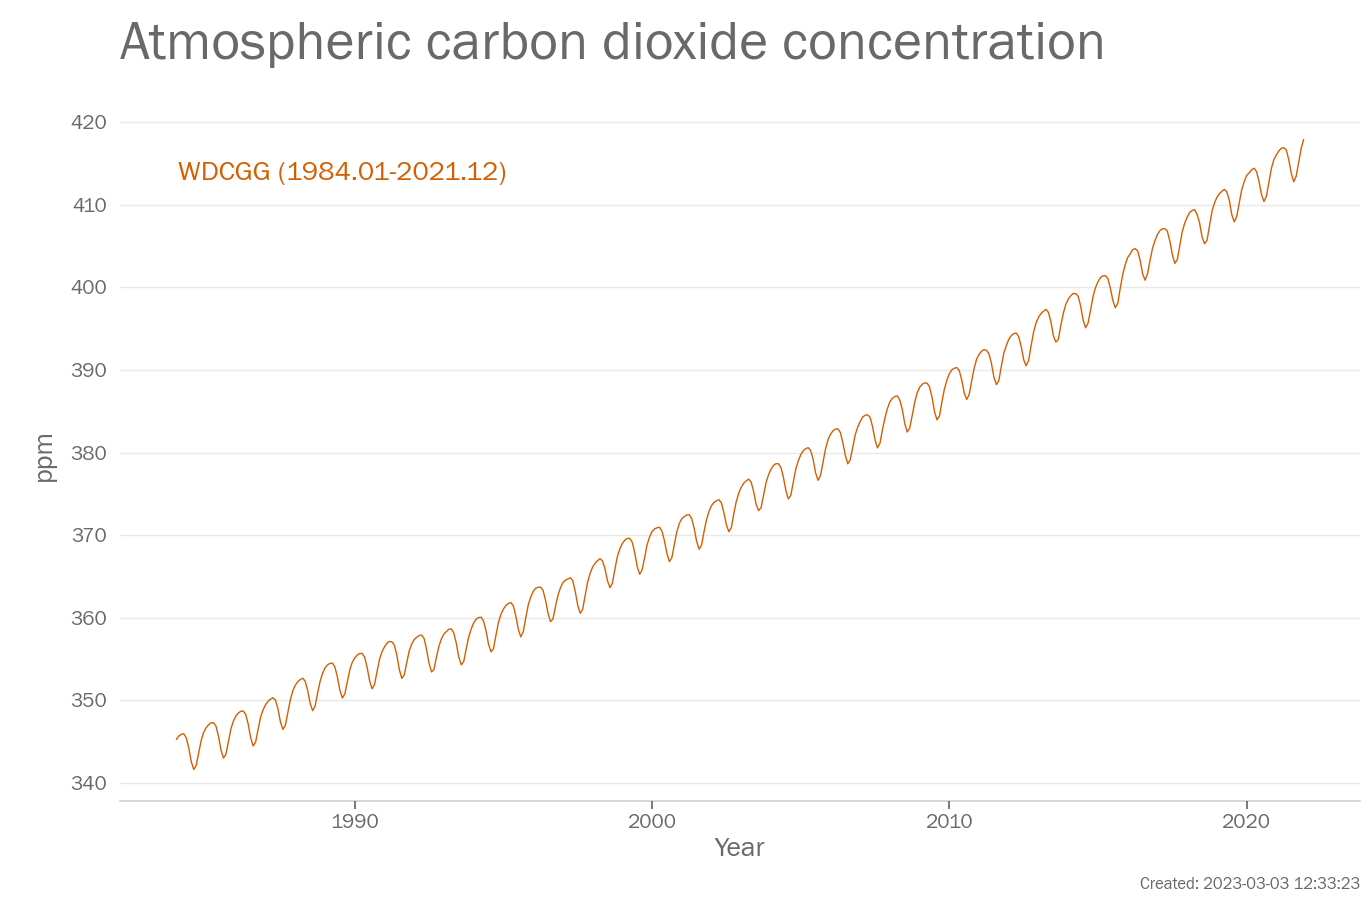
Greenhouse gases
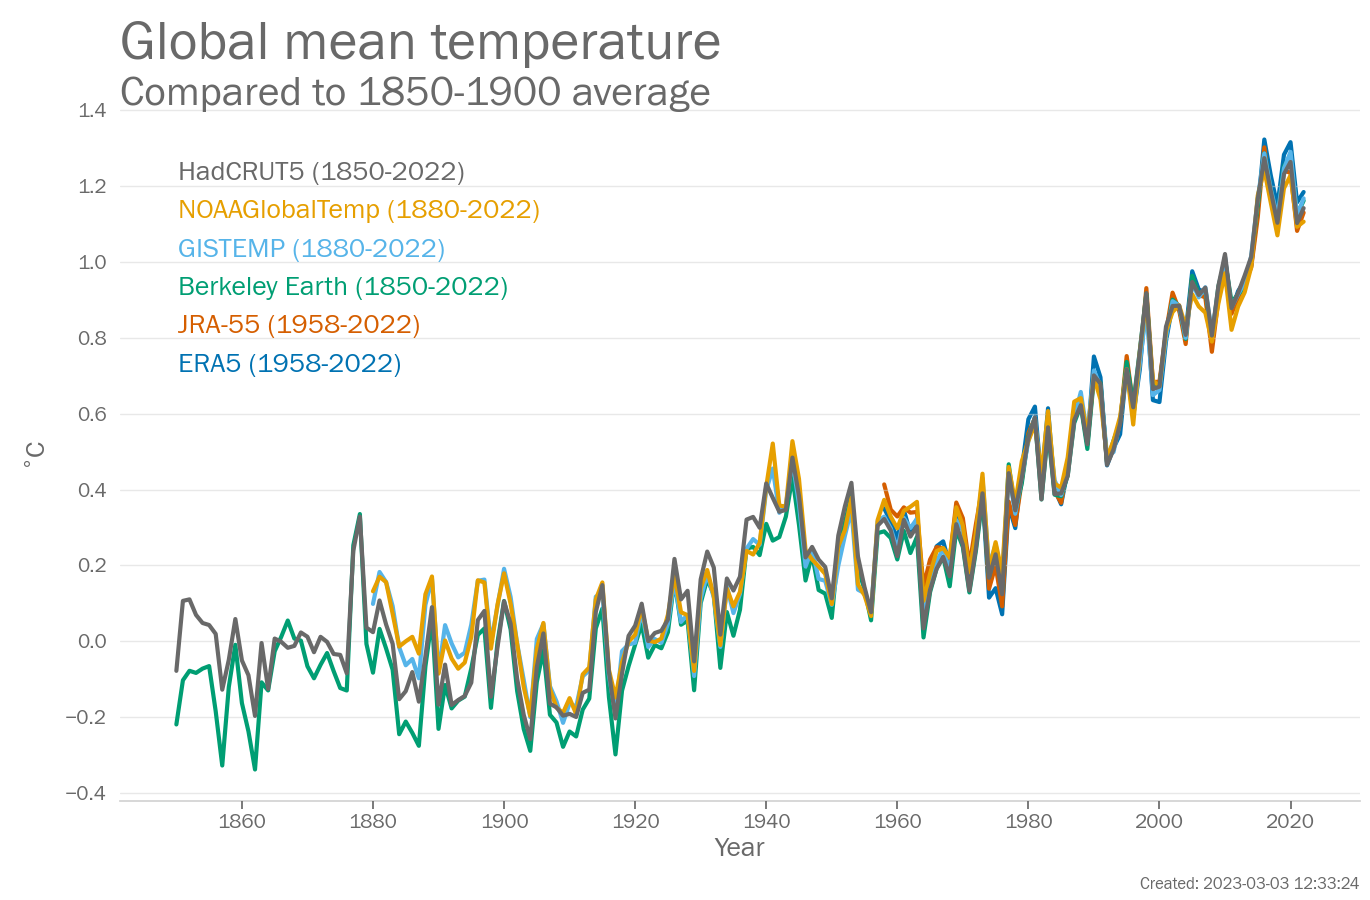
Global temperature
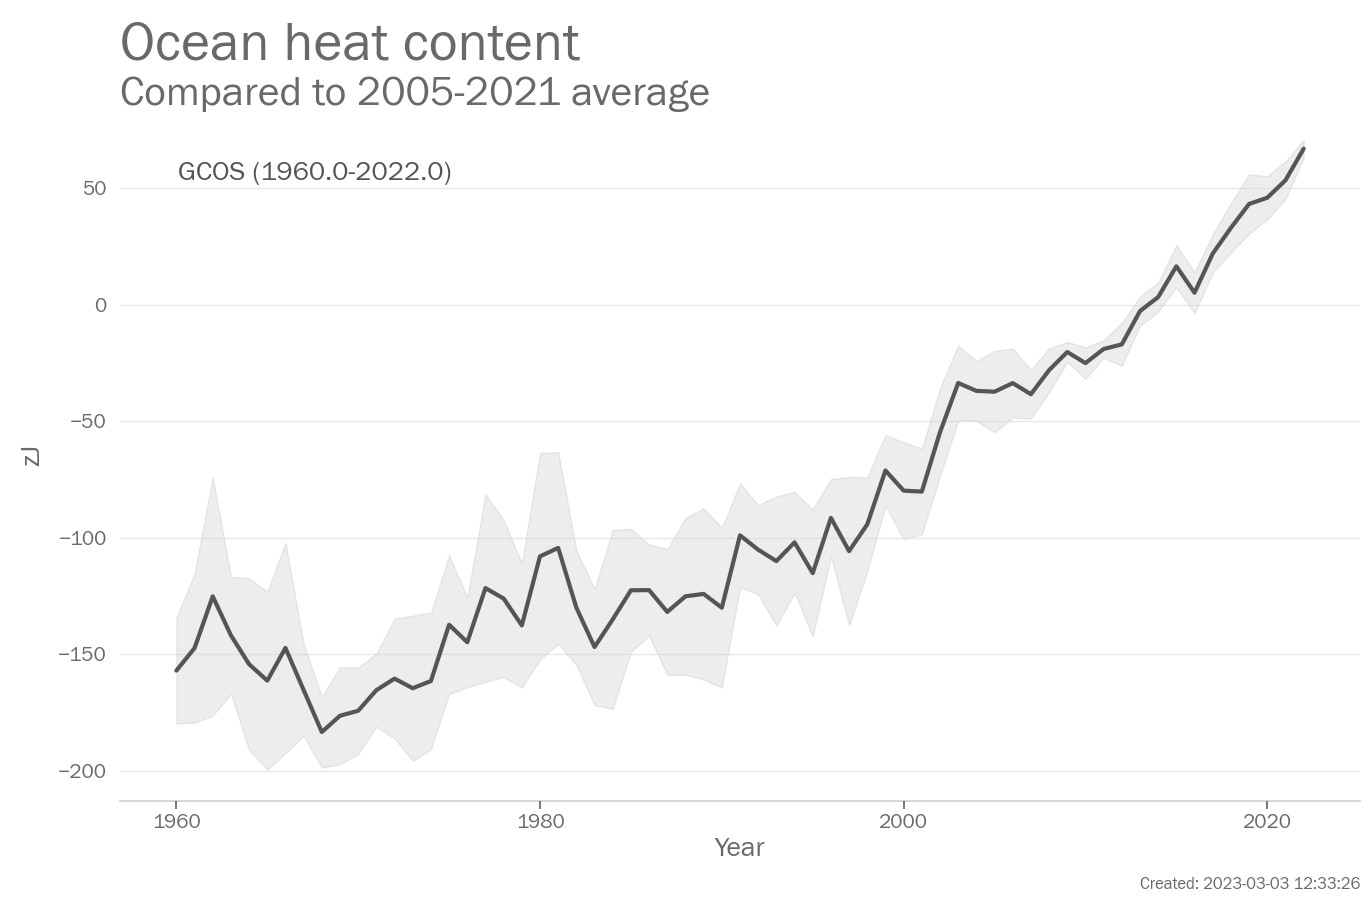
Ocean Indicators
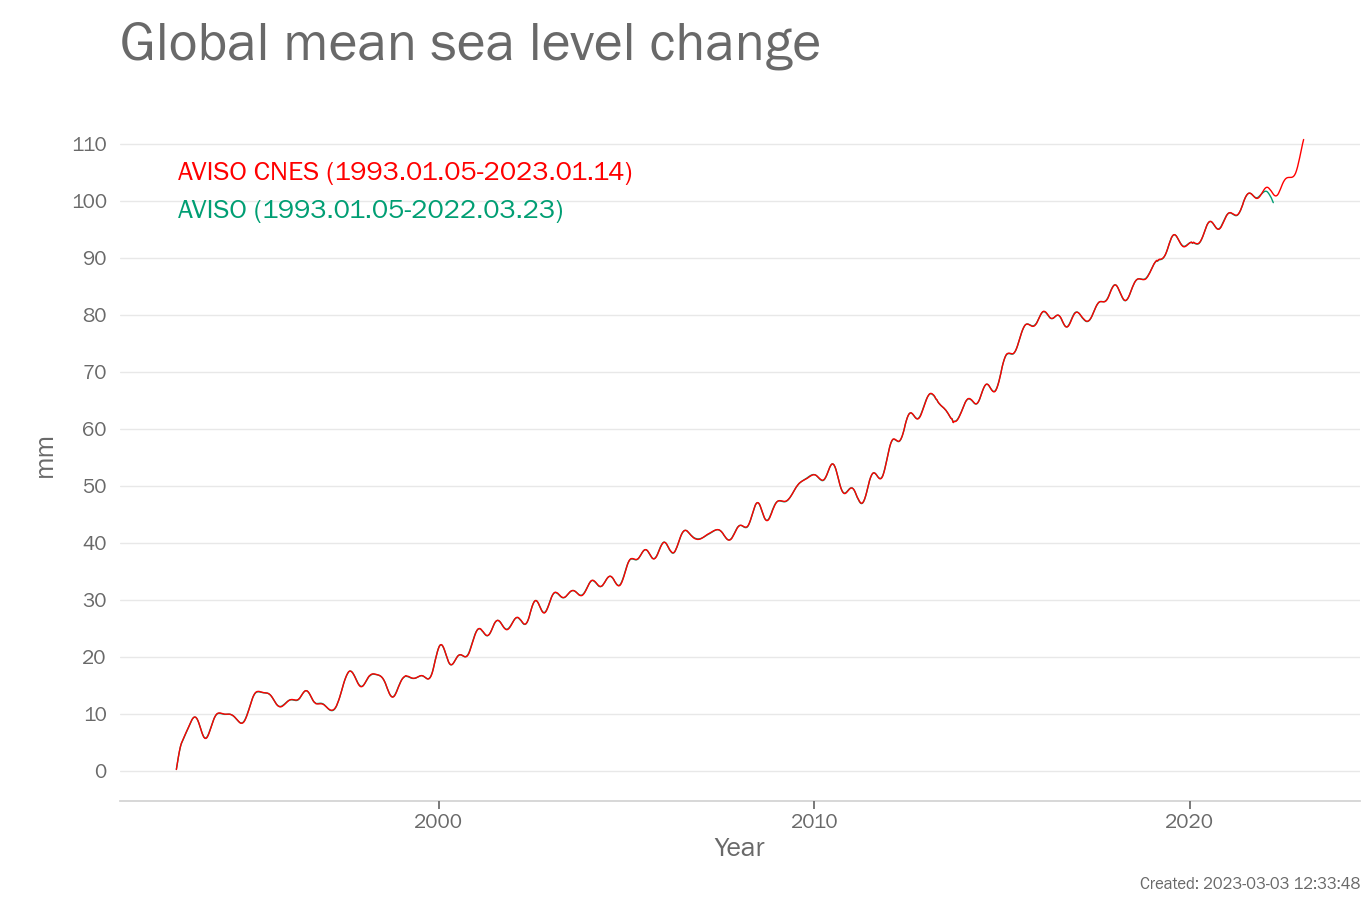
Sea level
Sea ice
Glaciers and ice sheets
Introduction
This page is a companion to the WMO State of the Global climate reports. It provides access to the latest versions of selected key global indicators used in the report.
Global climate indicators (for an overview see Trewin et al. 2021) provide a broad view of climate change at the largest scale, encompassing the composition of the atmosphere, energy changes, and the responses of the land, ocean, and ice. These indicators are closely related to one another. For example, the rise in CO2 and other greenhouse gases in the atmosphere leads to an imbalance of energy and thus warming of the atmosphere and ocean. Warming of the ocean in turn leads to rising sea levels, to which is added the melting of ice on land in response to increasing atmospheric temperatures.
The global indicators draw on a wide range of data sets, which are listed at the bottom of the page. Differences between data sets for the same indicator indicate the degree of uncertainty in the indicator. Figures are updated at least annually, with some data sets being updated more frequently.
Under each of the figures, you will find links to the images in multiple file formats (png, pdf and svg), as well as a set of data as shown in the figure in a common comma-separated values (csv) format. The "Read more" link will take you to a wider range of linked indicators.
What the IPCC says
Regarding the large-scale changes in the climate, Working Group 1 from the sixth assessment report of the Intergovernmental Panel on Climate Change concluded that:
A.1 It is unequivocal that human influence has warmed the atmosphere, ocean and land. Widespread and rapid changes in the atmosphere, ocean, cryosphere and biosphere have occurred.
A.2 The scale of recent changes across the climate system as a whole - and the present state of many aspects of the climate system - are unprecedented over many centuries to many thousands of years.
A.3 Human-induced climate change is already affecting many weather and climate extremes in every region across the globe. Evidence of observed changes in extremes such as heatwaves, heavy precipitation, droughts, and tropical cyclones, and, in particular, their attribution to human influence, has strengthened since AR5.
Key messages
Global mean temperature
The year 2022 was ranked between the 5th and 6th warmest on record. The anomaly for 2022 was 1.15 [1.02 to 1.28]°C relative to the 1850-1900 average 6 data sets were used in this assessment: Berkeley Earth, ERA5, GISTEMP, HadCRUT5, JRA-55, and NOAAGlobalTemp.
Global mean sea level
The rate of change in the AVISO data set is 3.3 mm/yr between 1993 and 2022.The rate of change in the AVISO CNES data set is 3.4 mm/yr between 1993 and 2022.
Arctic sea-ice extent
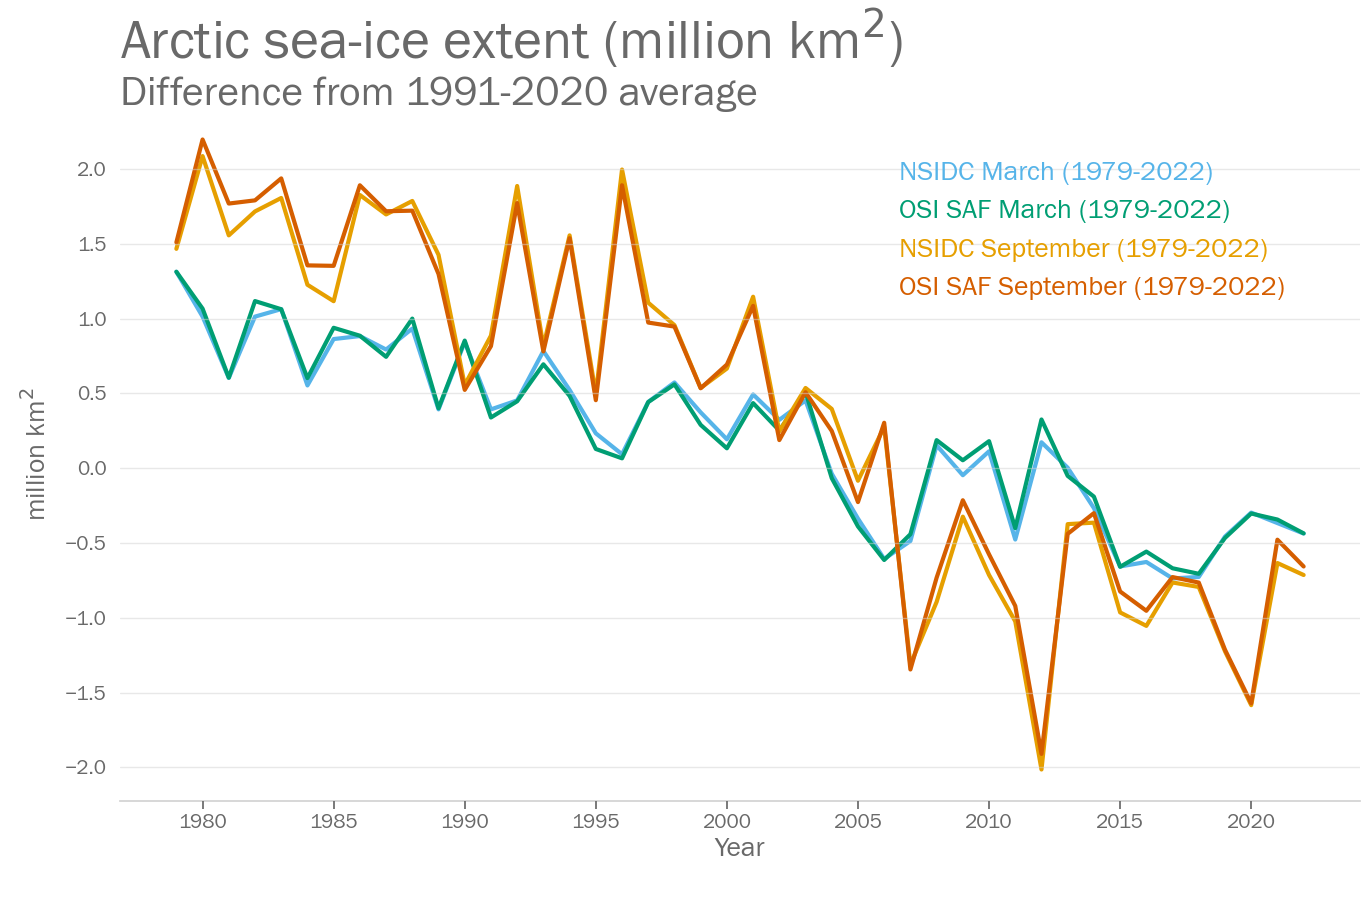
Arctic sea ice extent in March 2022 was between 14.59 and 14.70million km2. This was between the 8th and 9th lowest extent on record. In September the extent was between 4.87 and 5.39million km2. This was the 11th lowest extent on record. Data sets used were: NSIDC and OSI SAF
Dataset and processing details
Greenhouse gases
Carbon dioxide (CO2) is one of the most important greenhouse gases. The concentration of CO2 in the atmosphere is measured at stations around the world which are combined to provide a globally representative value.
The data in the above plot are available in a zip file containing a csv file for each data set.
Data file: Greenhouse_gases_data_files.zip
Checksum: 55c1a9f00eef59abd8afd2c0bfed15c3
Format: BADC CSV format
WDCGG
Original data file (external link)
Citation: WMO Greenhouse Gas Bulletin, No.18, 2022. 26 October 2022 ISSN 2078-0796.
To produce the plot, the following processing steps were performed:
- Data set created from file ['co2_monthly_20221026.csv'] downloaded from ['https://gaw.kishou.go.jp/static/publications/global_mean_mole_fractions/2022/co2_monthly_20221026.csv'] at ['2023-02-27 09:20:00']
Global temperature
Global mean temperature is based on measurements made at weather stations over land and by ships and buoys over the ocean. Temperatures are typically expressed as anomalies which are temperature differences from the average for a standard period. Here, 1850-1900 is used for the global mean. Instrumental temperature records are some of the longest climate records available, with some series extending back to the 17th century.
The data in the above plot are available in a zip file containing a csv file for each data set.
Data file: Global_temperature_data_files.zip
Checksum: 39cc283ee1b0626f3628fcc71fe5d282
Format: BADC CSV format
Berkeley Earth
Original data file (external link)
To produce the plot, the following processing steps were performed:
- Data set created from file ['Land_and_Ocean_complete.txt'] downloaded from ['http://berkeleyearth.lbl.gov/auto/Global/Land_and_Ocean_complete.txt'] at ['2023-02-27 09:15:23']
- Rebaselined to 1981-2010 for each month separately by calculating the arithmetic mean of the data over the baseline period and subtracting the mean from all data values. This is done for each month separately (Januarys, Februarys etc).
- Calculated annual average from monthly averages using arithmetic mean
- Selected years within the range 1850 to 2022.
- Added offset of 0.69 to all data values.
- Manually changed baseline to 1850-1900. Note that data values remain unchanged.
ERA5
Original data file (external link)
Citations: Hersbach H, Bell B, Berrisford P et al. 2020. The ERA5 global reanalysis. Q. J. R. Meteorol. Soc. 146: 1999-2049. https://doi.org/10.1002/qj.3803. Bell, B., Hersbach, H., Simmons, A., Berrisford, P., Dahlgren, P., Horányi, A., et al. (2021) The ERA5 global reanalysis: Preliminary extension to 1950. Q J R Meteorol Soc, 147 741, 4186-4227. https://doi.org/10.1002/qj.4174.
To produce the plot, the following processing steps were performed:
- Data set created from file ['era5_monthy_sfc_temp_ano_global_1958-2022_for_wmo.csv'] downloaded from ['era5_monthy_sfc_temp_ano_global_1958-2022_for_wmo.csv'] at ['2023-02-09 16:00:54']
- Rebaselined to 1981-2010 for each month separately by calculating the arithmetic mean of the data over the baseline period and subtracting the mean from all data values. This is done for each month separately (Januarys, Februarys etc).
- Calculated annual average from monthly averages using arithmetic mean
- Selected years within the range 1850 to 2022.
- Added offset of 0.69 to all data values.
- Manually changed baseline to 1850-1900. Note that data values remain unchanged.
GISTEMP
Original data file (external link)
Data citation: GISTEMP Team, 2022: GISS Surface Temperature Analysis (GISTEMP), version 4. NASA Goddard Institute for Space Studies. Dataset accessed 2023-02-27 09:16:55 at data.giss.nasa.gov/gistemp/.
To produce the plot, the following processing steps were performed:
- Data set created from file ['GLB.Ts+dSST.csv'] downloaded from ['https://data.giss.nasa.gov/gistemp/tabledata_v4/GLB.Ts+dSST.csv'] at ['2023-02-27 09:16:55']
- Rebaselined to 1981-2010 for each month separately by calculating the arithmetic mean of the data over the baseline period and subtracting the mean from all data values. This is done for each month separately (Januarys, Februarys etc).
- Calculated annual average from monthly averages using arithmetic mean
- Selected years within the range 1850 to 2022.
- Added offset of 0.69 to all data values.
- Manually changed baseline to 1850-1900. Note that data values remain unchanged.
HadCRUT5
Original data file (external link) Original data file (external link)
Acknowledgement: HadCRUT.5.0.1.0 data were obtained from http://www.metoffice.gov.uk/hadobs/hadcrut5 on 2023-02-27 09:17:43 and are © British Crown Copyright, Met Office 2023, provided under an Open Government License, http://www.nationalarchives.gov.uk/doc/open-government-licence/version/3/
To produce the plot, the following processing steps were performed:
- Data set created from file ['HadCRUT.5.0.1.0.analysis.summary_series.global.monthly.csv', 'HadCRUT.5.0.1.0.analysis.summary_series.global.annual.csv'] downloaded from ['https://www.metoffice.gov.uk/hadobs/hadcrut5/data/current/analysis/diagnostics/HadCRUT.5.0.1.0.analysis.summary_series.global.monthly.csv', 'https://www.metoffice.gov.uk/hadobs/hadcrut5/data/current/analysis/diagnostics/HadCRUT.5.0.1.0.analysis.summary_series.global.annual.csv'] at ['2023-02-27 09:17:43', '2023-02-27 09:17:43']
- Rebaselined to 1981-2010 for each month separately by calculating the arithmetic mean of the data over the baseline period and subtracting the mean from all data values. This is done for each month separately (Januarys, Februarys etc).
- Calculated annual average from monthly averages using arithmetic mean
- Selected years within the range 1850 to 2022.
- Added offset of 0.69 to all data values.
- Manually changed baseline to 1850-1900. Note that data values remain unchanged.
JRA-55
Original data file (external link)
To produce the plot, the following processing steps were performed:
- Data set created from file ['JRA-55_tmp2m_global_ts_Clim8110.txt'] downloaded from [''] at ['2023-01-09 10:09:00']
- Rebaselined to 1981-2010 for each month separately by calculating the arithmetic mean of the data over the baseline period and subtracting the mean from all data values. This is done for each month separately (Januarys, Februarys etc).
- Calculated annual average from monthly averages using arithmetic mean
- Selected years within the range 1850 to 2022.
- Added offset of 0.69 to all data values.
- Manually changed baseline to 1850-1900. Note that data values remain unchanged.
NOAAGlobalTemp
Original data file (external link) Original data file (external link)
Citations: Huang, B., M. J. Menne, T. Boyer, E. Freeman, B. E. Gleason, J. H. Lawrimore, C. Liu, J. J. Rennie, C. Schreck, F. Sun, R. Vose, C. N. Williams, X. Yin, H.-M. Zhang, 2020: Uncertainty estimates for sea surface temperature and land surface air temperature in NOAAGlobalTemp version 5. , J. Climate, 33, 1351-1379, DOI: 10.1175/JCLI-D-19-0395.1. Zhang, Huai-Min, Jay H. Lawrimore, Boyin Huang, Matthew J. Menne, Xungang Yin, Ahira Sȧnchez-Lugo, Byron E. Gleason, Russell Vose, Derek Arndt, J. Jared Rennie, and Claude N. Williams. (2019) Updated Temperature Data Give a Sharper View of Climate Trends. Eos, 100, https://doi.org/10.1029/2019EO128229.
Data citation: Zhang, H.-M., B. Huang, J. Lawrimore, M. Menne, Thomas M. Smith, NOAA Global Surface Temperature Dataset (NOAAGlobalTemp), Version 5 [indicate subset used]. NOAA National Centers for Environmental Information. doi:10.25921/9qth-2p70 Accessed [2023-02-27 09:18:13].
To produce the plot, the following processing steps were performed:
- Data set created from file ['aravg.mon.land_ocean.90S.90N.v5.0.0.202212.asc', 'aravg.ann.land_ocean.90S.90N.*.asc'] downloaded from ['https://www.ncei.noaa.gov/data/noaa-global-surface-temperature/v5/access/timeseries/aravg.mon.land_ocean.90S.90N.v5.0.0.202212.asc', 'https://www.ncei.noaa.gov/data/noaa-global-surface-temperature/v5/access/timeseries/aravg.ann.land_ocean.90S.90N.*.asc'] at ['2023-02-27 09:18:13']
- Rebaselined to 1981-2010 for each month separately by calculating the arithmetic mean of the data over the baseline period and subtracting the mean from all data values. This is done for each month separately (Januarys, Februarys etc).
- Calculated annual average from monthly averages using arithmetic mean
- Selected years within the range 1850 to 2022.
- Added offset of 0.69 to all data values.
- Manually changed baseline to 1850-1900. Note that data values remain unchanged.
Ocean Indicators
Ocean heat content is a measure of the change in heat energy stored in the subsurface ocean. It is based on temperature measurements made by research vessels (since the 1950s), moorings, and automated profiling floats (known as Argo floats) since the 2000s.
The data in the above plot are available in a zip file containing a csv file for each data set.
Data file: Ocean_Indicators_data_files.zip
Checksum: 095e48e219645fe220db29e2e12ae898
Format: BADC CSV format
GCOS
Original data file (external link) Original data file (external link)
Data citation: von Schuckmann, Karina; Minière, Audrey; Gues, Flora; Cuesta-Valero, Francisco; Kirchengast, Gottfried; Adusumilli, Susheel; Straneo, Fiammetta; Allan, Richard; Barker, Paul M.; Beltrami, Hugo; Boyer, Tim; Cheng, Lijing; Church, John; Desbruyeres, Damien; Dolman, Han; Domingues, Catia; García-García, Almudena; Giglio, Donata; Gilson, John; Gorfer, Maximilian; Haimberger, Leopold; Hendricks, Stefan; Hosoda, Shigeki; Johnson, Gregory; Killick, Rachel; King, Brian; Kolodziejczyk, Nicolas; Korosov, Anton; Krinner, Gerhard; Kuusela, Mikael; Langer, Moritz; Lavergne, Thomas; Li, Yuehua; Lyman, John; Marzeion, Ben; Mayer, Michael; MacDougall, Andrew; Lawrence, Isobel; McDougall, Trevor; Monselesan, Didier; Nitzbon, Jean; Otosaka, Inès; Peng, Jian; Purkey, Sarah; Roemmich, Dean; Sato, Kanako; Sato, Katsunari; Savita, Abhishek; Schweiger, Axel; Shepherd, Andrew; Seneviratne, Sonia; Simons, Leon; Slater, Donald; Slater, Thomas; Smith, Noah; Steiner, Andrea; Suga, Toshio; Szekely, Tanguy; Thiery, Wim; Timmermanns, Mary-Louise; Vanderkelen, Inne; Wijffels, Susan; Wu, Tonghua; Zemp, Michael (2022). Heat stored in the Earth system 1960-2020: Where does the energy go?. World Data Center for Climate (WDCC) at DKRZ. https://www.wdc-climate.de/ui/entry?acronym=GCOS_EHI_1960-2020
To produce the plot, the following processing steps were performed:
- Data set created from file ['GCOS_EHI_1960-2020_Earth_Heat_Inventory_Ocean_Heat_Content_data.nc', 'WMO_global_OHC_60N60S_mean_spread_1960-2021_ZJ.nc'] downloaded from ['https://www.wdc-climate.de/WDCC/ui/download/transferArchive?acronym=GCOS_EHI_1960-2020_OHC_d&rmin=0&rmax=0', ''] at ['2023-02-13 17:48:00']
Sea level
Global mean sea level is a measured by satellites using radar altimeters that record the time taken for a radar signal to reach the sea-surface and return to the satellite. Longer records of sea level (not shown here) exist based on tide gauge measurements made along coastlines around the world since the late 19th century.
The data in the above plot are available in a zip file containing a csv file for each data set.
Data file: Sea_level_data_files.zip
Checksum: 025f1699a250d80e9671f94703428130
Format: BADC CSV format
AVISO
Original data file (external link)
Acknowledgement: Generated using AVISO+ Products
To produce the plot, the following processing steps were performed:
- Data set created from file ['GMSL_Aviso_Merged_NRTJ3_Ablain_drift_corrected_ts.txt'] downloaded from [''] at ['2022-07-29 17:40:00']
AVISO CNES
Original data file (external link)
Acknowledgement: Generated using AVISO+ Products
To produce the plot, the following processing steps were performed:
- Data set created from file ['MSL_Serie_MERGED_Global_AVISO_GIA_Adjust_Filter6m_NRT.nc'] downloaded from ['ftp://ftp.aviso.altimetry.fr/pub/oceano/AVISO/indicators/msl/MSL_Serie_MERGED_Global_AVISO_GIA_Adjust_Filter6m_NRT.nc'] at ['2023-02-27 09:15:21']
Sea ice
Sea-ice concentrations are estimated from microwave radiances measured from satellites (from 1979). Sea-ice extent is calculated as the area of ocean grid cells where the sea-ice concentration exceeds 15%. Although there are relatively large differences in the absolute extent between data sets, they agree well on the year-to-year changes and the trends.
The data in the above plot are available in a zip file containing a csv file for each data set.
Data file: Sea_ice_data_files.zip
Checksum: e0935d86dbc05be60b18b42966dd40cc
Format: BADC CSV format
NSIDC
Original data file (external link) Original data file (external link) Original data file (external link) Original data file (external link) Original data file (external link) Original data file (external link) Original data file (external link) Original data file (external link) Original data file (external link) Original data file (external link) Original data file (external link) Original data file (external link)
Data citation: Fetterer, F., K. Knowles, W. N. Meier, M. Savoie, and A. K. Windnagel. 2017, updated daily. Sea Ice Index, Version 3. 1979-present. Boulder, Colorado USA. NSIDC: National Snow and Ice Data Center. doi: https://doi.org/10.7265/N5K072F8. [2023-02-27 09:19:31].
Acknowledgement: Fetterer, F., K. Knowles, W. N. Meier, M. Savoie, and A. K. Windnagel. 2017, updated daily. Sea Ice Index, Version 3. 1979-present. Boulder, Colorado USA. NSIDC: National Snow and Ice Data Center. doi: https://doi.org/10.7265/N5K072F8. [2023-02-27 09:19:31].
To produce the plot, the following processing steps were performed:
- Data set created from file ['N_01_extent_v3.0.csv', 'N_02_extent_v3.0.csv', 'N_03_extent_v3.0.csv', 'N_04_extent_v3.0.csv', 'N_05_extent_v3.0.csv', 'N_06_extent_v3.0.csv', 'N_07_extent_v3.0.csv', 'N_08_extent_v3.0.csv', 'N_09_extent_v3.0.csv', 'N_10_extent_v3.0.csv', 'N_11_extent_v3.0.csv', 'N_12_extent_v3.0.csv'] downloaded from ['ftp://sidads.colorado.edu/DATASETS/NOAA/G02135/north/monthly/data/N_01_extent_v3.0.csv', 'ftp://sidads.colorado.edu/DATASETS/NOAA/G02135/north/monthly/data/N_02_extent_v3.0.csv', 'ftp://sidads.colorado.edu/DATASETS/NOAA/G02135/north/monthly/data/N_03_extent_v3.0.csv', 'ftp://sidads.colorado.edu/DATASETS/NOAA/G02135/north/monthly/data/N_04_extent_v3.0.csv', 'ftp://sidads.colorado.edu/DATASETS/NOAA/G02135/north/monthly/data/N_05_extent_v3.0.csv', 'ftp://sidads.colorado.edu/DATASETS/NOAA/G02135/north/monthly/data/N_06_extent_v3.0.csv', 'ftp://sidads.colorado.edu/DATASETS/NOAA/G02135/north/monthly/data/N_07_extent_v3.0.csv', 'ftp://sidads.colorado.edu/DATASETS/NOAA/G02135/north/monthly/data/N_08_extent_v3.0.csv', 'ftp://sidads.colorado.edu/DATASETS/NOAA/G02135/north/monthly/data/N_09_extent_v3.0.csv', 'ftp://sidads.colorado.edu/DATASETS/NOAA/G02135/north/monthly/data/N_10_extent_v3.0.csv', 'ftp://sidads.colorado.edu/DATASETS/NOAA/G02135/north/monthly/data/N_11_extent_v3.0.csv', 'ftp://sidads.colorado.edu/DATASETS/NOAA/G02135/north/monthly/data/N_12_extent_v3.0.csv'] at ['2023-02-27 09:19:31', '2023-02-27 09:19:32', '2023-02-27 09:19:33', '2023-02-27 09:19:34', '2023-02-27 09:19:35', '2023-02-27 09:19:36', '2023-02-27 09:19:38', '2023-02-27 09:19:39', '2023-02-27 09:19:40', '2023-02-27 09:19:41', '2023-02-27 09:19:42', '2023-02-27 09:19:43']
- Rebaselined to 1991-2020 for each month separately by calculating the arithmetic mean of the data over the baseline period and subtracting the mean from all data values. This is done for each month separately (Januarys, Februarys etc).
- Calculated annual series by extracting March from each year
- Calculated annual series by extracting September from each year
OSI SAF
Original data file (external link)
Data citation: EUMETSAT Ocean and Sea Ice Satellite Application Facility, Sea ice index 1979-onwards (v2.1, 2020), OSI-420, Data extracted from OSI SAF FTP server: 1979-present, Northern Hemisphere, accessed 2023-02-27 09:19:47
Acknowledgement: The OSI SAF Sea Ice Index v2.1 is made available at https://osisaf-hl.met.no/v2p1-sea-ice-index. The OSI SAF Sea Ice Index v2p1 is prepared using EUMETSAT OSI SAF Sea Ice Concentration data, with R&D input from the ESA Climate Change Initiative (ESA CCI) (Lavergne et al. 2019)
To produce the plot, the following processing steps were performed:
- Data set created from file ['osisaf_nh_sie_monthly.txt'] downloaded from ['ftp://osisaf.met.no/prod_test/ice/index/v2p1/nh/osisaf_nh_sie_monthly.txt'] at ['2023-02-27 09:19:47']
- Rebaselined to 1991-2020 for each month separately by calculating the arithmetic mean of the data over the baseline period and subtracting the mean from all data values. This is done for each month separately (Januarys, Februarys etc).
- Calculated annual series by extracting March from each year
- Calculated annual series by extracting September from each year
Glaciers and ice sheets
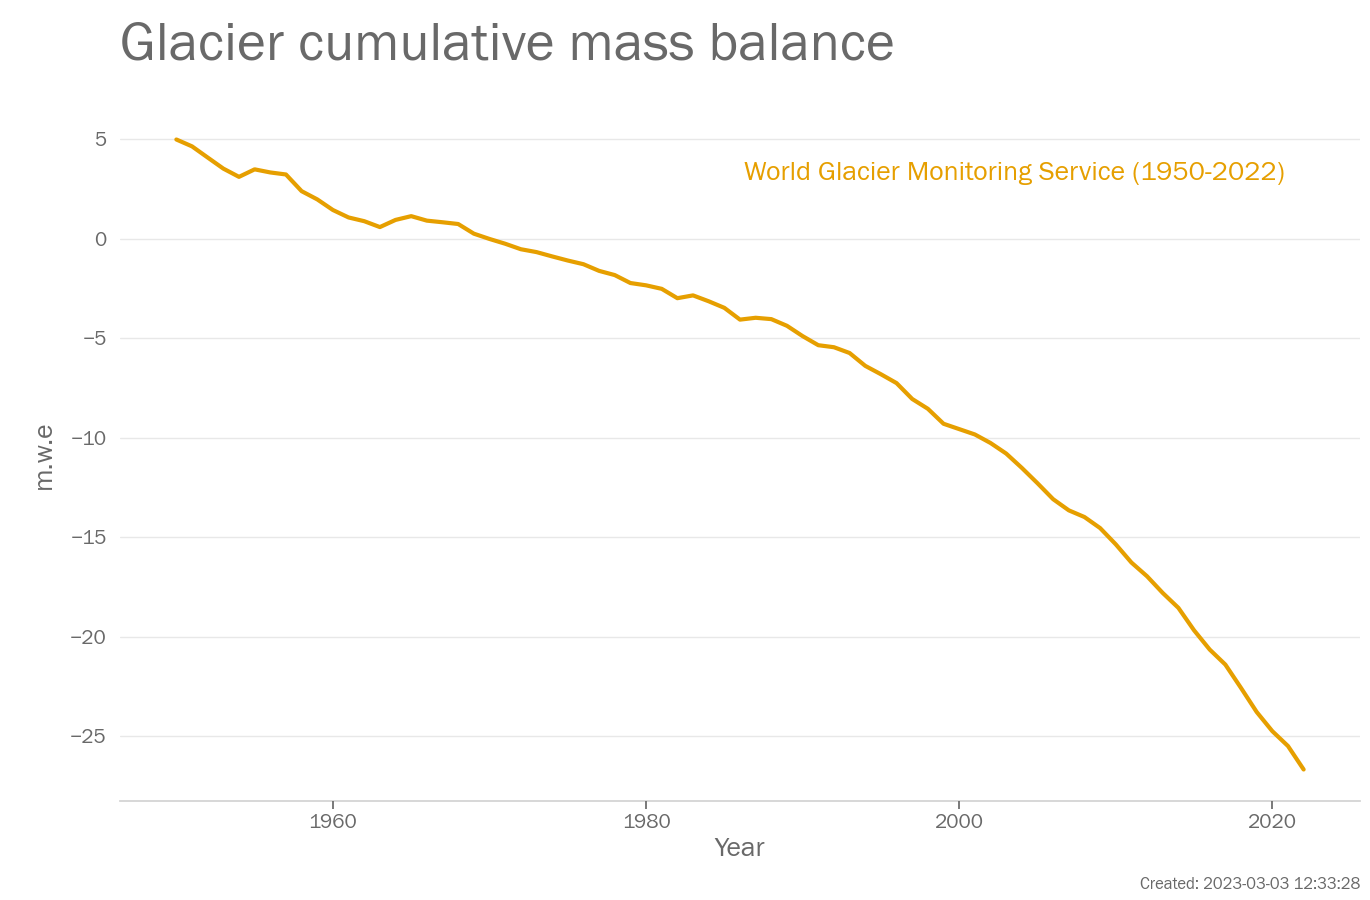
Glaciers are measured using a variety of different techniques. Glacier mass balance data for the global network of reference glaciers are available from the World Glacier Monitoring Service (WGMS), https://www.wgms.ch.
The data in the above plot are available in a zip file containing a csv file for each data set.
Data file: Glaciers_and_ice_sheets_data_files.zip
Checksum: 9ead2542899da72854d08546215f5992
Format: BADC CSV format
World Glacier Monitoring Service
Original data file (external link)
Data citation: WGMS (2017, updated, and earlier reports): Global Glacier Change Bulletin No. 2 (2014-2015). Zemp, M., Nussbaumer, S. U., Gärtner-Roer, I., Huber, J., Machguth, H., Paul, F., and Hoelzle, M. (eds.), ICSU(WDS)/IUGG(IACS)/UNEP/UNESCO/WMO, World Glacier Monitoring Service, Zurich, Switzerland, 244 pp., based on database version: doi:10.5904/wgms-fog-2018-11.
To produce the plot, the following processing steps were performed:
- Data set created from file ['mb_ref.csv'] downloaded from ['http://wgms.ch/data/faq/mb_ref.csv'] at ['2023-02-27 09:20:13']
Page created on 2023-03-03 using climind v0.1