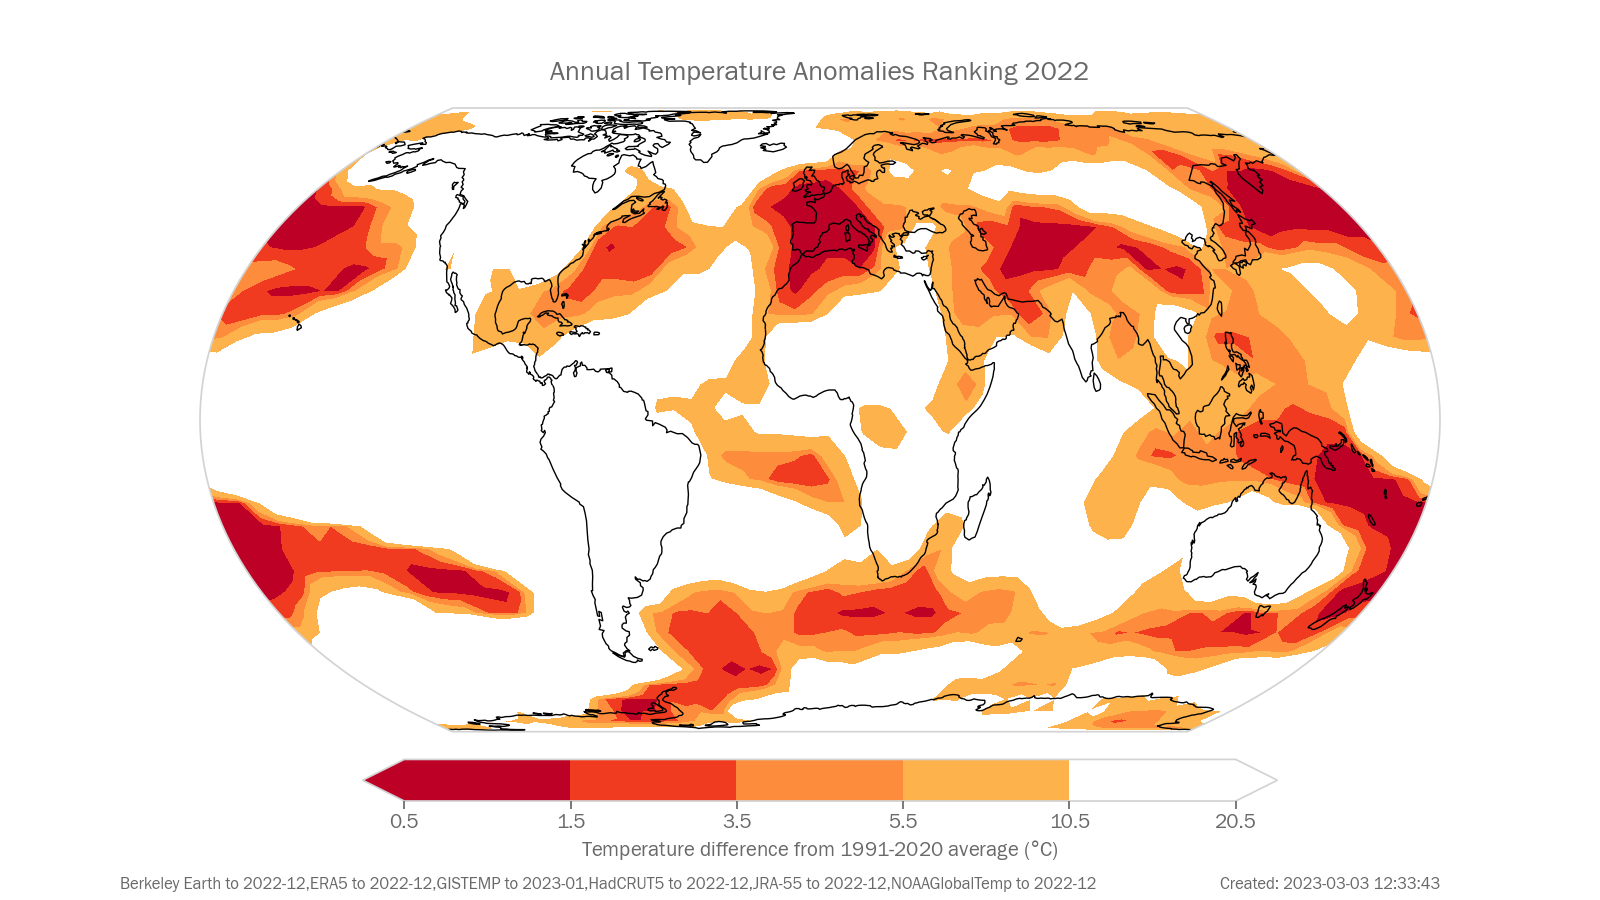
Global mean temperature
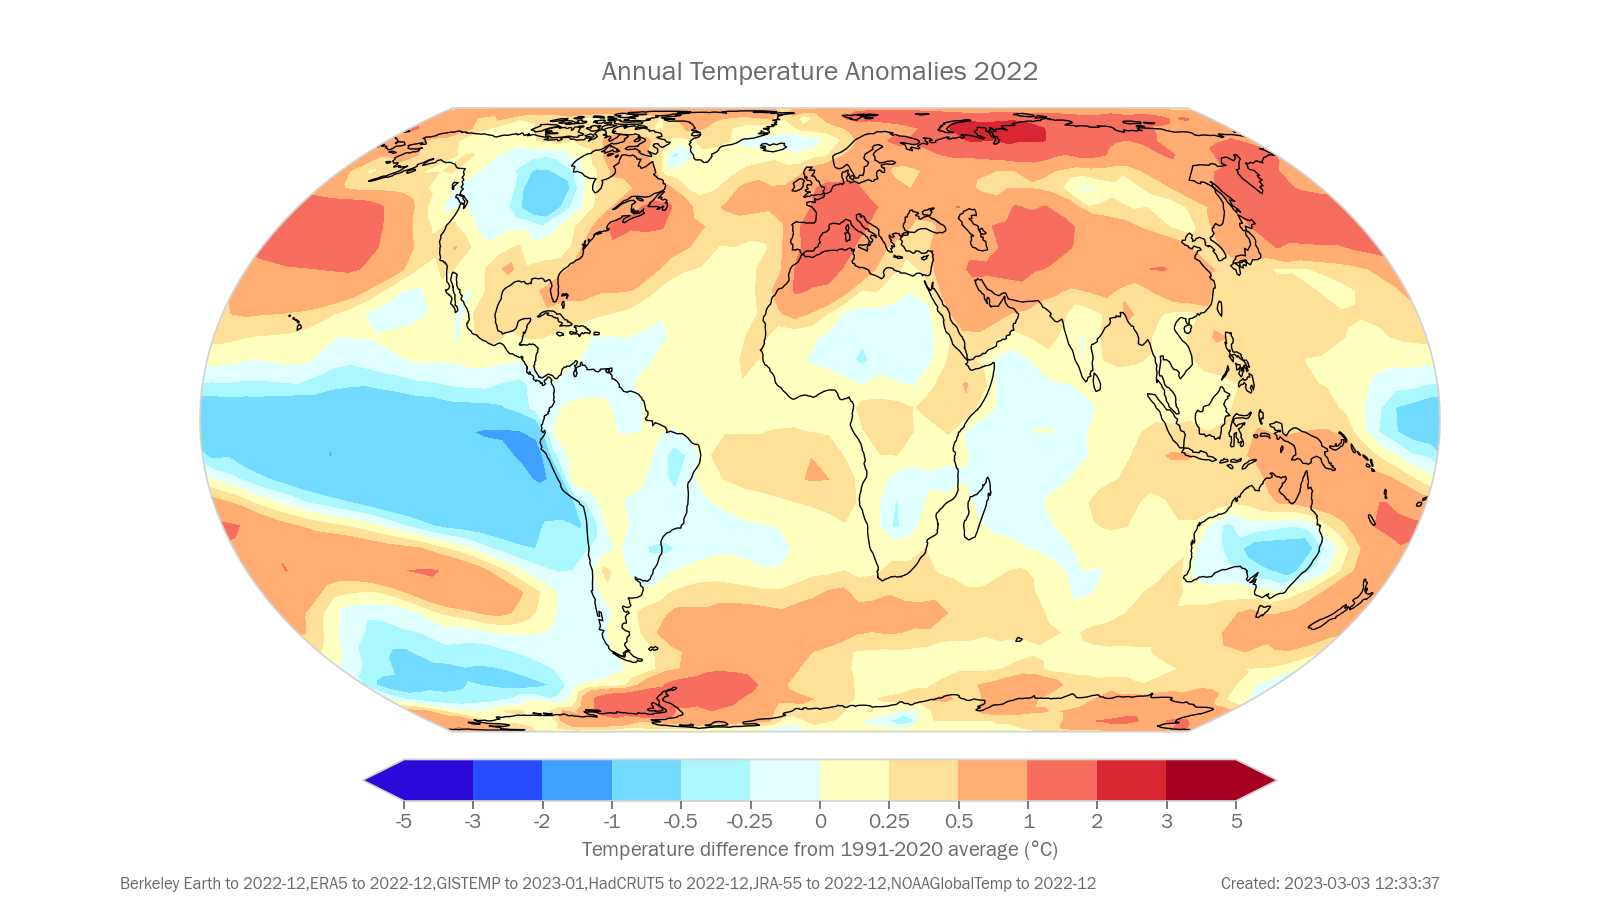
Temperature anomaly map
Annual Near surface temperature anomaly (°C, difference from the 1991-2020 average) for 2022. Data shown are the median of the following six data sets: Berkeley Earth, ERA5, GISTEMP, HadCRUT5, JRA-55, NOAAGlobalTemp.
Introduction
A key indicator of climate change is the global mean temperature. Global mean temperature measures the change in temperature near the surface of the Earth and averaged across its surface. Increased concentrations of greenhouse gases in the atmosphere are the primary driver of the long-term increase in global mean temperature.
The Paris Agreement aims to hold the increase in the global average temperature to well below 2°C above pre-industrial levels and pursue efforts to limit the temperature increase to 1.5°C above pre-industrial levels, recognizing that this would significantly reduce the risks and impacts of climate change. The Paris Agreement is generally understood to refer to long-term changes in temperature, so a single year that exceeds 1.5°C would not necessarily signal a breach of the threshold.
Warming of the Earth is not the same everywhere. The land has warmed more rapidly than the ocean and the rate of warming has been highest in the Arctic, which has warmed around two to four times faster than the global mean depending on the time period chosen.
What the IPCC says
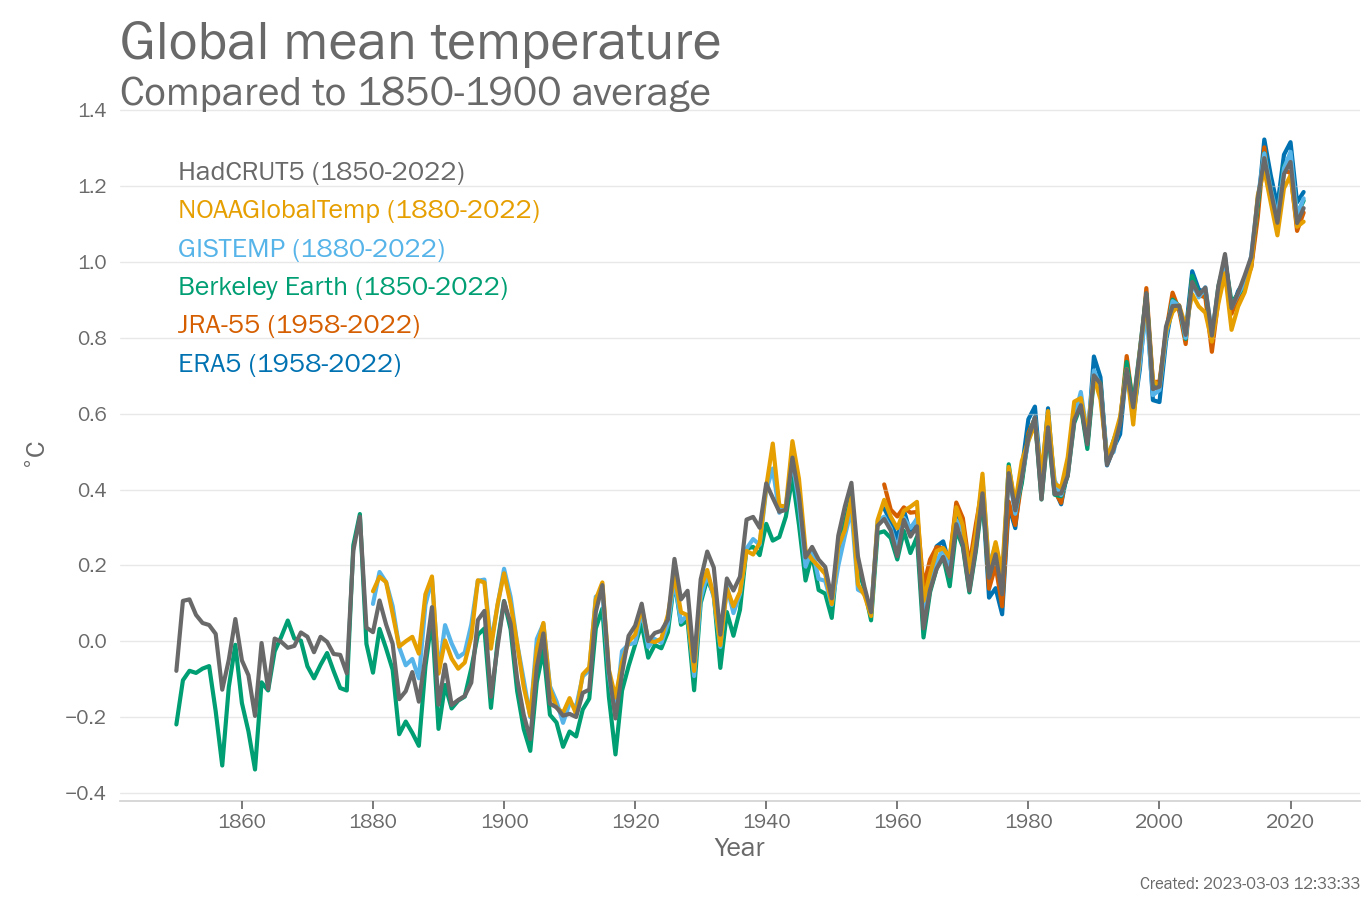
A.1.2 Each of the last four decades has been successively warmer than any decade that preceded it since 1850. Global surface temperature in the first two decades of the 21st century (2001-2020) was 0.99 [0.84 to 1.10] °C higher than 1850-1900. Global surface temperature was 1.09 [0.95 to 1.20] °C higher in 2011-2020 than 1850-1900, with larger increases over land (1.59 [1.34 to 1.83] °C) than over the ocean (0.88 [0.68 to 1.01] °C). The estimated increase in global surface temperature since AR5 is principally due to further warming since 2003-2012 (+0.19 [0.16 to 0.22] °C). Additionally, methodological advances and new datasets contributed approximately 0.1°C to the updated estimate of warming in AR6.
A.1.3 The likely range of total human-caused global surface temperature increase from 1850-1900 to 2010-2019 is 0.8°C to 1.3°C, with a best estimate of 1.07°C. It is likely that well-mixed GHGs contributed a warming of 1.0°C to 2.0°C, other human drivers (principally aerosols) contributed a cooling of 0.0°C to 0.8°C, natural drivers changed global surface temperature by -0.1°C to +0.1°C, and internal variability changed it by -0.2°C to +0.2°C. It is very likely that well-mixed GHGs were the main driver of tropospheric warming since 1979 and extremely likely that human-caused stratospheric ozone depletion was the main driver of cooling of the lower stratosphere between 1979 and the mid-1990s.
Key messages
Global mean temperature
The year 2022 was ranked between the 5th and 6th warmest on record. The anomaly for 2022 was 1.15 [1.02 to 1.28]°C relative to the 1850-1900 average 6 data sets were used in this assessment: Berkeley Earth, ERA5, GISTEMP, HadCRUT5, JRA-55, and NOAAGlobalTemp.
Global mean sea-surface temperature
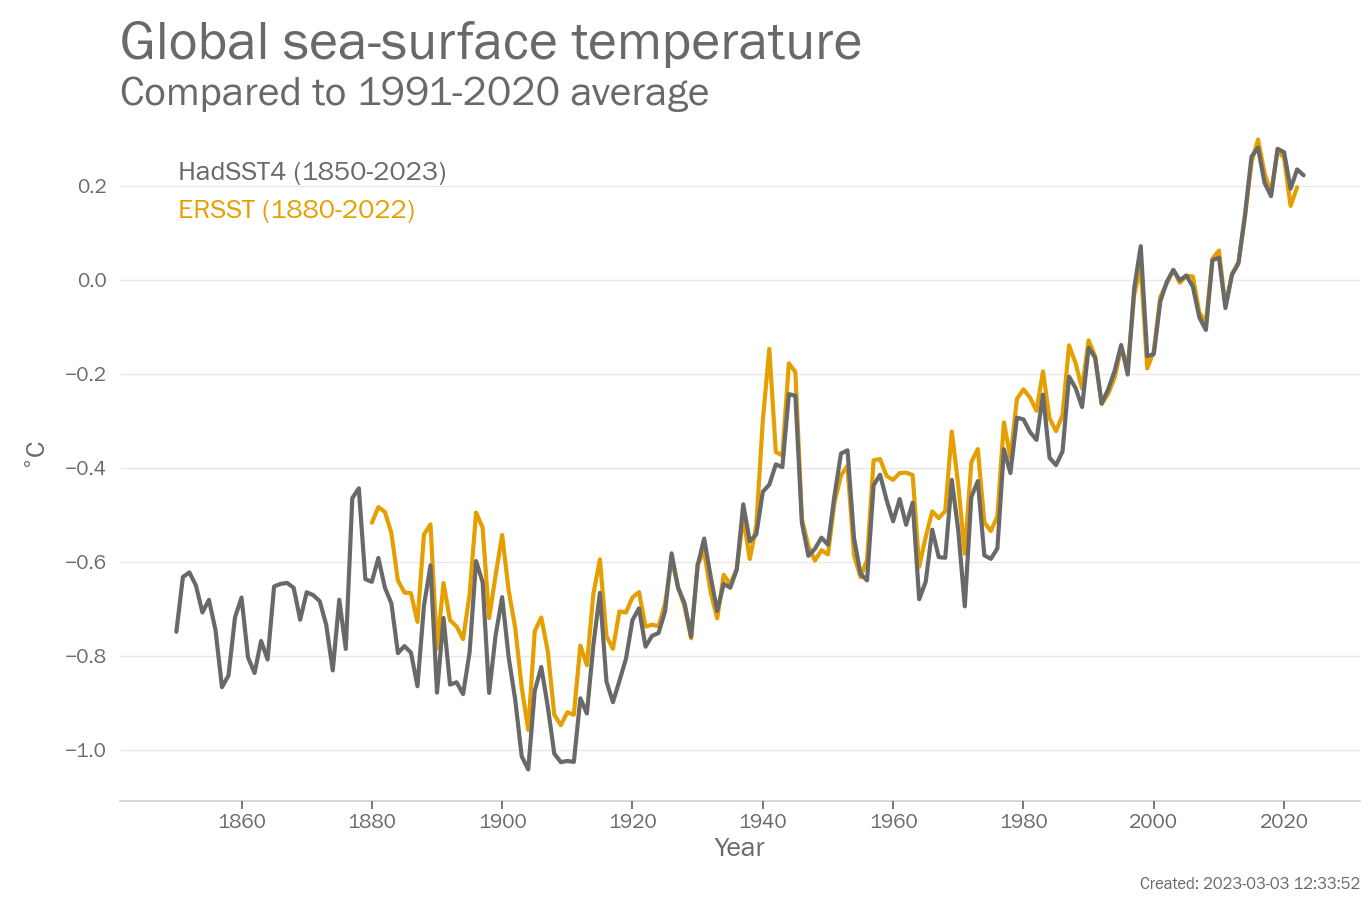
The year 2022 was ranked between the 5th and 6th highest on record. The mean value for 2022 was 0.22°C relative to the 1991-2020 average (0.20-0.23°C depending on the data set used). 2 data sets were used in this assessment: ERSST and HadSST4.The highest year on record was 2016 with a value between 0.28 and 0.30 °C.
The year 2021 was ranked the 8th highest on record. The mean value for 2021 was 0.18°C relative to the 1991-2020 average (0.16-0.19°C depending on the data set used). 2 data sets were used in this assessment: ERSST and HadSST4.
Global mean land temperature
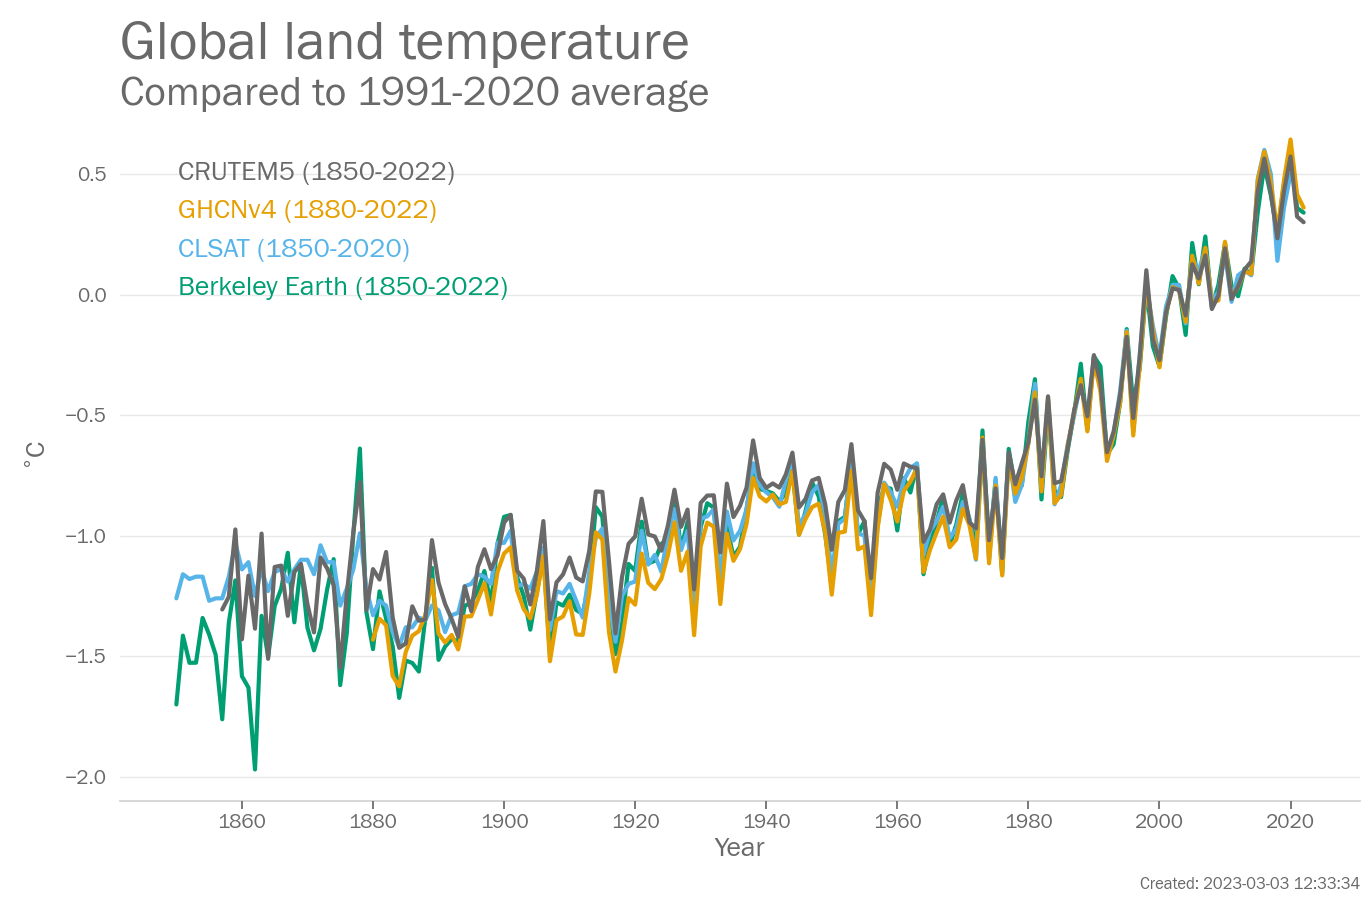
The year 2022 was ranked the 7th highest on record. The mean value for 2022 was 0.33°C relative to the 1991-2020 average (0.30-0.36°C depending on the data set used). 4 data sets were used in this assessment: Berkeley Earth, CLSAT, CRUTEM5, and GHCNv4.The highest year on record was one of 2016 (0.54-0.60°C) and 2020 (0.50-0.64°C).
The year 2021 was ranked between the 5th and 6th highest on record. The mean value for 2021 was 0.37°C relative to the 1991-2020 average (0.32-0.42°C depending on the data set used). 4 data sets were used in this assessment: Berkeley Earth, CLSAT, CRUTEM5, and GHCNv4.
Dataset and processing details
Global mean temperature
Global mean temperature is based on measurements made at weather stations over land and by ships and buoys over the ocean. Temperatures are typically expressed as anomalies which are temperature differences from the average for a standard period. Here, 1850-1900 is used for the global mean. Instrumental temperature records are some of the longest climate records available, with some series extending back to the 17th century.
The data in the above plot are available in a zip file containing a csv file for each data set.
Data file: Global_mean_temperature_data_files.zip
Checksum: 1f74b3a5db3696d790f97811970c0c7e
Format: BADC CSV format
Berkeley Earth
Original data file (external link)
To produce the plot, the following processing steps were performed:
- Data set created from file ['Land_and_Ocean_complete.txt'] downloaded from ['http://berkeleyearth.lbl.gov/auto/Global/Land_and_Ocean_complete.txt'] at ['2023-02-27 09:15:23']
- Rebaselined to 1981-2010 for each month separately by calculating the arithmetic mean of the data over the baseline period and subtracting the mean from all data values. This is done for each month separately (Januarys, Februarys etc).
- Calculated annual average from monthly averages using arithmetic mean
- Selected years within the range 1850 to 2022.
- Added offset of 0.69 to all data values.
- Manually changed baseline to 1850-1900. Note that data values remain unchanged.
ERA5
Original data file (external link)
Citations: Hersbach H, Bell B, Berrisford P et al. 2020. The ERA5 global reanalysis. Q. J. R. Meteorol. Soc. 146: 1999-2049. https://doi.org/10.1002/qj.3803. Bell, B., Hersbach, H., Simmons, A., Berrisford, P., Dahlgren, P., Horányi, A., et al. (2021) The ERA5 global reanalysis: Preliminary extension to 1950. Q J R Meteorol Soc, 147 741, 4186-4227. https://doi.org/10.1002/qj.4174.
To produce the plot, the following processing steps were performed:
- Data set created from file ['era5_monthy_sfc_temp_ano_global_1958-2022_for_wmo.csv'] downloaded from ['era5_monthy_sfc_temp_ano_global_1958-2022_for_wmo.csv'] at ['2023-02-09 16:00:54']
- Rebaselined to 1981-2010 for each month separately by calculating the arithmetic mean of the data over the baseline period and subtracting the mean from all data values. This is done for each month separately (Januarys, Februarys etc).
- Calculated annual average from monthly averages using arithmetic mean
- Selected years within the range 1850 to 2022.
- Added offset of 0.69 to all data values.
- Manually changed baseline to 1850-1900. Note that data values remain unchanged.
GISTEMP
Original data file (external link)
Data citation: GISTEMP Team, 2022: GISS Surface Temperature Analysis (GISTEMP), version 4. NASA Goddard Institute for Space Studies. Dataset accessed 2023-02-27 09:16:55 at data.giss.nasa.gov/gistemp/.
To produce the plot, the following processing steps were performed:
- Data set created from file ['GLB.Ts+dSST.csv'] downloaded from ['https://data.giss.nasa.gov/gistemp/tabledata_v4/GLB.Ts+dSST.csv'] at ['2023-02-27 09:16:55']
- Rebaselined to 1981-2010 for each month separately by calculating the arithmetic mean of the data over the baseline period and subtracting the mean from all data values. This is done for each month separately (Januarys, Februarys etc).
- Calculated annual average from monthly averages using arithmetic mean
- Selected years within the range 1850 to 2022.
- Added offset of 0.69 to all data values.
- Manually changed baseline to 1850-1900. Note that data values remain unchanged.
HadCRUT5
Original data file (external link) Original data file (external link)
Acknowledgement: HadCRUT.5.0.1.0 data were obtained from http://www.metoffice.gov.uk/hadobs/hadcrut5 on 2023-02-27 09:17:43 and are © British Crown Copyright, Met Office 2023, provided under an Open Government License, http://www.nationalarchives.gov.uk/doc/open-government-licence/version/3/
To produce the plot, the following processing steps were performed:
- Data set created from file ['HadCRUT.5.0.1.0.analysis.summary_series.global.monthly.csv', 'HadCRUT.5.0.1.0.analysis.summary_series.global.annual.csv'] downloaded from ['https://www.metoffice.gov.uk/hadobs/hadcrut5/data/current/analysis/diagnostics/HadCRUT.5.0.1.0.analysis.summary_series.global.monthly.csv', 'https://www.metoffice.gov.uk/hadobs/hadcrut5/data/current/analysis/diagnostics/HadCRUT.5.0.1.0.analysis.summary_series.global.annual.csv'] at ['2023-02-27 09:17:43', '2023-02-27 09:17:43']
- Rebaselined to 1981-2010 for each month separately by calculating the arithmetic mean of the data over the baseline period and subtracting the mean from all data values. This is done for each month separately (Januarys, Februarys etc).
- Calculated annual average from monthly averages using arithmetic mean
- Selected years within the range 1850 to 2022.
- Added offset of 0.69 to all data values.
- Manually changed baseline to 1850-1900. Note that data values remain unchanged.
JRA-55
Original data file (external link)
To produce the plot, the following processing steps were performed:
- Data set created from file ['JRA-55_tmp2m_global_ts_Clim8110.txt'] downloaded from [''] at ['2023-01-09 10:09:00']
- Rebaselined to 1981-2010 for each month separately by calculating the arithmetic mean of the data over the baseline period and subtracting the mean from all data values. This is done for each month separately (Januarys, Februarys etc).
- Calculated annual average from monthly averages using arithmetic mean
- Selected years within the range 1850 to 2022.
- Added offset of 0.69 to all data values.
- Manually changed baseline to 1850-1900. Note that data values remain unchanged.
NOAAGlobalTemp
Original data file (external link) Original data file (external link)
Citations: Huang, B., M. J. Menne, T. Boyer, E. Freeman, B. E. Gleason, J. H. Lawrimore, C. Liu, J. J. Rennie, C. Schreck, F. Sun, R. Vose, C. N. Williams, X. Yin, H.-M. Zhang, 2020: Uncertainty estimates for sea surface temperature and land surface air temperature in NOAAGlobalTemp version 5. , J. Climate, 33, 1351-1379, DOI: 10.1175/JCLI-D-19-0395.1. Zhang, Huai-Min, Jay H. Lawrimore, Boyin Huang, Matthew J. Menne, Xungang Yin, Ahira Sȧnchez-Lugo, Byron E. Gleason, Russell Vose, Derek Arndt, J. Jared Rennie, and Claude N. Williams. (2019) Updated Temperature Data Give a Sharper View of Climate Trends. Eos, 100, https://doi.org/10.1029/2019EO128229.
Data citation: Zhang, H.-M., B. Huang, J. Lawrimore, M. Menne, Thomas M. Smith, NOAA Global Surface Temperature Dataset (NOAAGlobalTemp), Version 5 [indicate subset used]. NOAA National Centers for Environmental Information. doi:10.25921/9qth-2p70 Accessed [2023-02-27 09:18:13].
To produce the plot, the following processing steps were performed:
- Data set created from file ['aravg.mon.land_ocean.90S.90N.v5.0.0.202212.asc', 'aravg.ann.land_ocean.90S.90N.*.asc'] downloaded from ['https://www.ncei.noaa.gov/data/noaa-global-surface-temperature/v5/access/timeseries/aravg.mon.land_ocean.90S.90N.v5.0.0.202212.asc', 'https://www.ncei.noaa.gov/data/noaa-global-surface-temperature/v5/access/timeseries/aravg.ann.land_ocean.90S.90N.*.asc'] at ['2023-02-27 09:18:13']
- Rebaselined to 1981-2010 for each month separately by calculating the arithmetic mean of the data over the baseline period and subtracting the mean from all data values. This is done for each month separately (Januarys, Februarys etc).
- Calculated annual average from monthly averages using arithmetic mean
- Selected years within the range 1850 to 2022.
- Added offset of 0.69 to all data values.
- Manually changed baseline to 1850-1900. Note that data values remain unchanged.
Land air temperature
Land surface air temperature is the temperature of air approximately 2m above the surface. It is measured at weather stations around the world. The thermometers used are typically housed in screens that shield the thermometer from direct sunlight, while allowing air to circulate freely.
The data in the above plot are available in a zip file containing a csv file for each data set.
Data file: Land_air_temperature_data_files.zip
Checksum: 1611a1c3977a1366f50b720a2fdbe732
Format: BADC CSV format
Berkeley Earth
Original data file (external link)
To produce the plot, the following processing steps were performed:
- Data set created from file ['Complete_TAVG_complete.txt'] downloaded from ['http://berkeleyearth.lbl.gov/auto/Global/Complete_TAVG_complete.txt'] at ['2023-02-27 09:15:28']
- Calculated annual average from monthly averages using arithmetic mean
- Rebaselined to 1991-2020 by subtracting the arithemtic mean for that period from all data values.
- Selected years within the range 1850 to 2022.
CLSAT
Original data file (external link)
Data citation: Sun Wenbin; Qingxiang, Li (2021): China global Land Surface Air Temperature 2.0 during 1850-2020. figshare. Dataset. https://doi.org/10.6084/m9.figshare.16968334.v4
To produce the plot, the following processing steps were performed:
- Data set created from file ['Land and ocean time series - final.csv'] downloaded from [''] at ['2022-10-14 12:46:13']
- Rebaselined to 1991-2020 by subtracting the arithemtic mean for that period from all data values.
- Selected years within the range 1850 to 2022.
CRUTEM5
Original data file (external link) Original data file (external link)
Acknowledgement: CRUTEM.5.0.0.0 data were obtained from http://www.metoffice.gov.uk/hadobs/crutem5 on 2023-02-27 09:15:39 and are © British Crown Copyright, Met Office 2023, provided under an Open Government License, http://www.nationalarchives.gov.uk/doc/open-government-licence/version/3/
To produce the plot, the following processing steps were performed:
- Data set created from file ['CRUTEM.5.0.1.0.summary_series.global.monthly.csv', 'CRUTEM.5.0.1.0.summary_series.global.annual.csv'] downloaded from ['https://www.metoffice.gov.uk/hadobs/crutem5/data/CRUTEM.5.0.1.0/diagnostics/CRUTEM.5.0.1.0.summary_series.global.monthly.csv', 'https://www.metoffice.gov.uk/hadobs/crutem5/data/CRUTEM.5.0.1.0/diagnostics/CRUTEM.5.0.1.0.summary_series.global.annual.csv'] at ['2023-02-27 09:15:39', '2023-02-27 09:15:40']
- Calculated annual average from monthly averages using arithmetic mean
- Rebaselined to 1991-2020 by subtracting the arithemtic mean for that period from all data values.
- Selected years within the range 1850 to 2022.
GHCNv4
Original data file (external link) Original data file (external link)
To produce the plot, the following processing steps were performed:
- Data set created from file ['aravg.mon.land.90S.90N.v5.0.0.2023MMMM.asc', 'aravg.ann.land.90S.90N.v5.0.0.2023MMMM.asc'] downloaded from ['https://www.ncei.noaa.gov/data/noaa-global-surface-temperature/v5/access/timeseries/aravg.mon.land.90S.90N.v5.0.0.2023MMMM.asc', 'https://www.ncei.noaa.gov/data/noaa-global-surface-temperature/v5/access/timeseries/aravg.ann.land.90S.90N.v5.0.0.2023MMMM.asc'] at ['2023-02-27 09:18:45']
- Calculated annual average from monthly averages using arithmetic mean
- Rebaselined to 1991-2020 by subtracting the arithemtic mean for that period from all data values.
- Selected years within the range 1850 to 2022.
Sea-surface temperature
Sea-surface temperature (SST) is the temperature of the surface ocean, typically measured in the upper metre, or metres of the ocean, by ships, buoys and satellites.
The data in the above plot are available in a zip file containing a csv file for each data set.
Data file: Sea-surface_temperature_data_files.zip
Checksum: 9225ac7f2bf46393788f14999da57ea7
Format: BADC CSV format
ERSST
Original data file (external link) Original data file (external link)
Data citation: Boyin Huang, Peter W. Thorne, Viva F. Banzon, Tim Boyer, Gennady Chepurin, Jay H. Lawrimore, Matthew J. Menne, Thomas M. Smith, Russell S. Vose, and Huai-Min Zhang (2017): NOAA Extended Reconstructed Sea Surface Temperature (ERSST), Version 5. [indicate subset used]. NOAA National Centers for Environmental Information. doi:10.7289/V5T72FNM [2023-02-27 09:16:30].
To produce the plot, the following processing steps were performed:
- Data set created from file ['aravg.mon.ocean.90S.90N.v5.0.0.2023MMMM.asc', 'aravg.ann.ocean.90S.90N.v5.0.0.2023MMMM.asc'] downloaded from ['https://www.ncei.noaa.gov/data/noaa-global-surface-temperature/v5/access/timeseries/aravg.mon.ocean.90S.90N.v5.0.0.2023MMMM.asc', 'https://www.ncei.noaa.gov/data/noaa-global-surface-temperature/v5/access/timeseries/aravg.ann.ocean.90S.90N.v5.0.0.2023MMMM.asc'] at ['2023-02-27 09:16:30']
- Calculated annual average from monthly averages using arithmetic mean
- Rebaselined to 1991-2020 by subtracting the arithemtic mean for that period from all data values.
HadSST4
Original data file (external link) Original data file (external link)
Acknowledgement: HadSST.4.0.1.0 data were obtained from http://www.metoffice.gov.uk/hadobs/hadsst4 on 2023-02-27 09:17:44 and are © British Crown Copyright, Met Office 2023, provided under an Open Government License, http://www.nationalarchives.gov.uk/doc/open-government-licence/version/3/
To produce the plot, the following processing steps were performed:
- Data set created from file ['HadSST.4.0.1.0_monthly_GLOBE.csv', 'HadSST.4.0.1.0_annual_GLOBE.csv'] downloaded from ['https://www.metoffice.gov.uk/hadobs/hadsst4/data/csv/HadSST.4.0.1.0_monthly_GLOBE.csv', 'https://www.metoffice.gov.uk/hadobs/hadsst4/data/csv/HadSST.4.0.1.0_annual_GLOBE.csv'] at ['2023-02-27 09:17:44', '2023-02-27 09:17:44']
- Calculated annual average from monthly averages using arithmetic mean
- Rebaselined to 1991-2020 by subtracting the arithemtic mean for that period from all data values.
Temperature anomaly map
Global mean temperature is based on measurements made at weather stations over land and by ships and buoys over the ocean. Temperatures are typically expressed as anomalies which are temperature differences from the average for a standard period. Here, 1850-1900 is used for the global mean. Instrumental temperature records are some of the longest climate records available, with some series extending back to the 17th century.
The data in the above plot are available in a zip file containing a csv file for each data set.
Data file: Temperature_anomaly_map_data_files.zip
Checksum: 76cdb2bad9582d23c1f6f4d868218d6c
Format: BADC CSV format
Berkeley Earth
Original data file (external link)
To produce the plot, the following processing steps were performed:
- Data set created from file ['Land_and_Ocean_LatLong1.nc'] downloaded from ['http://berkeleyearth.lbl.gov/auto/Global/Gridded/Land_and_Ocean_LatLong1.nc'] at ['2023-02-16 09:21:24']
- Regridded to 5 degree latitude-longitude resolution
- Rebaselined to 1991-2020
- Calculated annual average
- Wrote to file Berkeley Earth_5x5.nc
- Gridded dataset created from file ['Berkeley Earth_5x5.nc'] downloaded from ['']
- Selected year range 2022 to 2022
ERA5
Original data file (external link)
Citations: Hersbach H, Bell B, Berrisford P et al. 2020. The ERA5 global reanalysis. Q. J. R. Meteorol. Soc. 146: 1999-2049. https://doi.org/10.1002/qj.3803. Bell, B., Hersbach, H., Simmons, A., Berrisford, P., Dahlgren, P., Horányi, A., et al. (2021) The ERA5 global reanalysis: Preliminary extension to 1950. Q J R Meteorol Soc, 147 741, 4186-4227. https://doi.org/10.1002/qj.4174.
To produce the plot, the following processing steps were performed:
- Gridded dataset created from file ['era5_2m_tas_YYYY.nc'] downloaded from ['extension']
- Regridded to 5 degree latitude-longitude resolution
- Rebaselined to 1991-2020
- Calculated annual average
- Wrote to file ERA5_5x5.nc
- Gridded dataset created from file ['ERA5_5x5.nc'] downloaded from ['']
- Selected year range 2022 to 2022
GISTEMP
Original data file (external link)
Data citation: GISTEMP Team, 2022: GISS Surface Temperature Analysis (GISTEMP), version 4. NASA Goddard Institute for Space Studies. Dataset accessed 2023-02-16 09:22:04 at data.giss.nasa.gov/gistemp/.
To produce the plot, the following processing steps were performed:
- Data set created from file ['gistemp1200_GHCNv4_ERSSTv5.nc.gz'] downloaded from ['https://data.giss.nasa.gov/pub/gistemp/gistemp1200_GHCNv4_ERSSTv5.nc.gz'] at ['2023-02-16 09:22:04']
- Regridded to 5 degree latitude-longitude resolution
- Rebaselined to 1991-2020
- Calculated annual average
- Wrote to file GISTEMP_5x5.nc
- Gridded dataset created from file ['GISTEMP_5x5.nc'] downloaded from ['']
- Selected year range 2022 to 2022
HadCRUT5
Original data file (external link)
Acknowledgement: HadCRUT.VVVV data were obtained from http://www.metoffice.gov.uk/hadobs/hadcrut5 on AAAA and are © British Crown Copyright, Met Office YYYY, provided under an Open Government License, http://www.nationalarchives.gov.uk/doc/open-government-licence/version/3/
To produce the plot, the following processing steps were performed:
- Gridded dataset created from file ['HadCRUT.5.0.1.0.analysis.anomalies.ensemble_mean.nc'] downloaded from ['https://www.metoffice.gov.uk/hadobs/hadcrut5/data/current/analysis/HadCRUT.5.0.1.0.analysis.anomalies.ensemble_mean.nc']
- Rebaselined to 1991-2020
- Calculated annual average
- Wrote to file HadCRUT5_5x5.nc
- Gridded dataset created from file ['HadCRUT5_5x5.nc'] downloaded from ['']
- Selected year range 2022 to 2022
JRA-55
Original data file (external link)
To produce the plot, the following processing steps were performed:
- Data set created from file ['anl_surf125.011_tmp.202301_202312', 'anl_surf125.2023MMMM'] downloaded from ['', ''] at ['2023-01-09 09:22:14']
- Regridded to 5 degree latitude-longitude resolution
- Rebaselined to 1991-2020
- Calculated annual average
- Wrote to file JRA-55_5x5.nc
- Gridded dataset created from file ['JRA-55_5x5.nc'] downloaded from ['']
- Selected year range 2022 to 2022
NOAAGlobalTemp
Original data file (external link)
Citations: Huang, B., M. J. Menne, T. Boyer, E. Freeman, B. E. Gleason, J. H. Lawrimore, C. Liu, J. J. Rennie, C. Schreck, F. Sun, R. Vose, C. N. Williams, X. Yin, H.-M. Zhang, 2020: Uncertainty estimates for sea surface temperature and land surface air temperature in NOAAGlobalTemp version 5. , J. Climate, 33, 1351-1379, DOI: 10.1175/JCLI-D-19-0395.1. Zhang, Huai-Min, Jay H. Lawrimore, Boyin Huang, Matthew J. Menne, Xungang Yin, Ahira Sȧnchez-Lugo, Byron E. Gleason, Russell Vose, Derek Arndt, J. Jared Rennie, and Claude N. Williams. (2019) Updated Temperature Data Give a Sharper View of Climate Trends. Eos, 100, https://doi.org/10.1029/2019EO128229.
Data citation: Zhang, H.-M., B. Huang, J. Lawrimore, M. Menne, Thomas M. Smith, NOAA Global Surface Temperature Dataset (NOAAGlobalTemp), Version 5 [indicate subset used]. NOAA National Centers for Environmental Information. doi:10.25921/9qth-2p70 Accessed [2023-02-16 09:22:15].
To produce the plot, the following processing steps were performed:
- Data set created from file ['NOAAGlobalTemp_v*.nc'] downloaded from ['https://www.ncei.noaa.gov/data/noaa-global-surface-temperature/v5/access/gridded/NOAAGlobalTemp_v.*.nc'] at ['2023-02-16 09:22:15']
- Rebaselined to 1991-2020
- Calculated annual average
- Wrote to file NOAAGlobalTemp_5x5.nc
- Gridded dataset created from file ['NOAAGlobalTemp_5x5.nc'] downloaded from ['']
- Selected year range 2022 to 2022
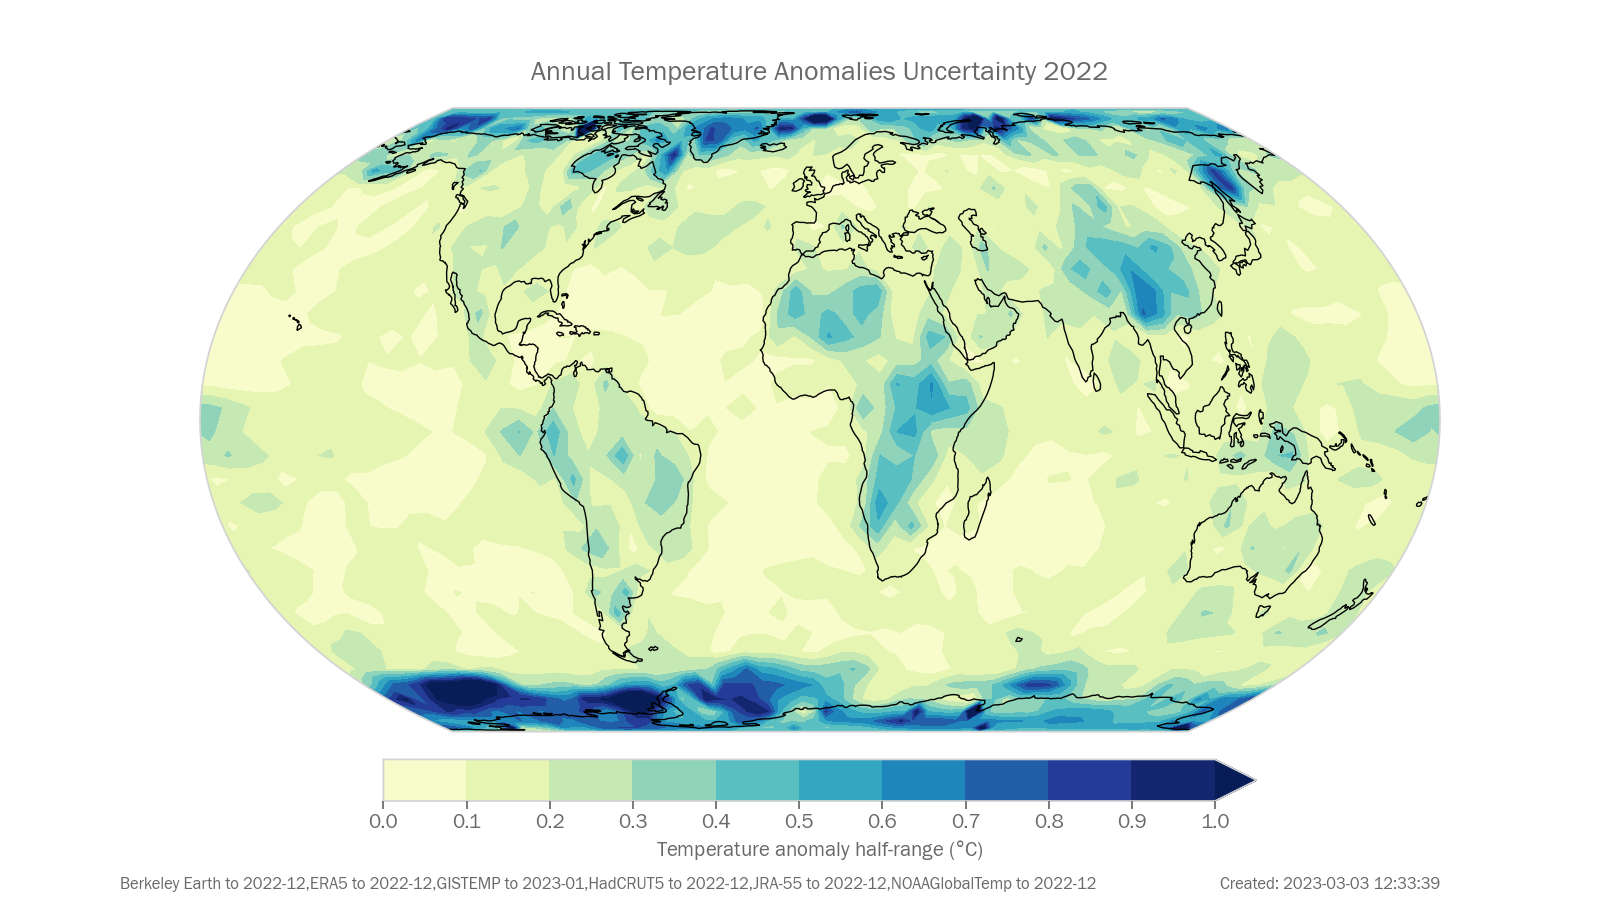
Temperature anomaly uncertainty map
Global mean temperature is based on measurements made at weather stations over land and by ships and buoys over the ocean. Temperatures are typically expressed as anomalies which are temperature differences from the average for a standard period. Here, 1850-1900 is used for the global mean. Instrumental temperature records are some of the longest climate records available, with some series extending back to the 17th century.
The data in the above plot are available in a zip file containing a csv file for each data set.
Data file: Temperature_anomaly_uncertainty_map_data_files.zip
Checksum: 76cdb2bad9582d23c1f6f4d868218d6c
Format: BADC CSV format
Berkeley Earth
Original data file (external link)
To produce the plot, the following processing steps were performed:
- Data set created from file ['Land_and_Ocean_LatLong1.nc'] downloaded from ['http://berkeleyearth.lbl.gov/auto/Global/Gridded/Land_and_Ocean_LatLong1.nc'] at ['2023-02-16 09:21:24']
- Regridded to 5 degree latitude-longitude resolution
- Rebaselined to 1991-2020
- Calculated annual average
- Wrote to file Berkeley Earth_5x5.nc
- Gridded dataset created from file ['Berkeley Earth_5x5.nc'] downloaded from ['']
- Selected year range 2022 to 2022
ERA5
Original data file (external link)
Citations: Hersbach H, Bell B, Berrisford P et al. 2020. The ERA5 global reanalysis. Q. J. R. Meteorol. Soc. 146: 1999-2049. https://doi.org/10.1002/qj.3803. Bell, B., Hersbach, H., Simmons, A., Berrisford, P., Dahlgren, P., Horányi, A., et al. (2021) The ERA5 global reanalysis: Preliminary extension to 1950. Q J R Meteorol Soc, 147 741, 4186-4227. https://doi.org/10.1002/qj.4174.
To produce the plot, the following processing steps were performed:
- Gridded dataset created from file ['era5_2m_tas_YYYY.nc'] downloaded from ['extension']
- Regridded to 5 degree latitude-longitude resolution
- Rebaselined to 1991-2020
- Calculated annual average
- Wrote to file ERA5_5x5.nc
- Gridded dataset created from file ['ERA5_5x5.nc'] downloaded from ['']
- Selected year range 2022 to 2022
GISTEMP
Original data file (external link)
Data citation: GISTEMP Team, 2022: GISS Surface Temperature Analysis (GISTEMP), version 4. NASA Goddard Institute for Space Studies. Dataset accessed 2023-02-16 09:22:04 at data.giss.nasa.gov/gistemp/.
To produce the plot, the following processing steps were performed:
- Data set created from file ['gistemp1200_GHCNv4_ERSSTv5.nc.gz'] downloaded from ['https://data.giss.nasa.gov/pub/gistemp/gistemp1200_GHCNv4_ERSSTv5.nc.gz'] at ['2023-02-16 09:22:04']
- Regridded to 5 degree latitude-longitude resolution
- Rebaselined to 1991-2020
- Calculated annual average
- Wrote to file GISTEMP_5x5.nc
- Gridded dataset created from file ['GISTEMP_5x5.nc'] downloaded from ['']
- Selected year range 2022 to 2022
HadCRUT5
Original data file (external link)
Acknowledgement: HadCRUT.VVVV data were obtained from http://www.metoffice.gov.uk/hadobs/hadcrut5 on AAAA and are © British Crown Copyright, Met Office YYYY, provided under an Open Government License, http://www.nationalarchives.gov.uk/doc/open-government-licence/version/3/
To produce the plot, the following processing steps were performed:
- Gridded dataset created from file ['HadCRUT.5.0.1.0.analysis.anomalies.ensemble_mean.nc'] downloaded from ['https://www.metoffice.gov.uk/hadobs/hadcrut5/data/current/analysis/HadCRUT.5.0.1.0.analysis.anomalies.ensemble_mean.nc']
- Rebaselined to 1991-2020
- Calculated annual average
- Wrote to file HadCRUT5_5x5.nc
- Gridded dataset created from file ['HadCRUT5_5x5.nc'] downloaded from ['']
- Selected year range 2022 to 2022
JRA-55
Original data file (external link)
To produce the plot, the following processing steps were performed:
- Data set created from file ['anl_surf125.011_tmp.202301_202312', 'anl_surf125.2023MMMM'] downloaded from ['', ''] at ['2023-01-09 09:22:14']
- Regridded to 5 degree latitude-longitude resolution
- Rebaselined to 1991-2020
- Calculated annual average
- Wrote to file JRA-55_5x5.nc
- Gridded dataset created from file ['JRA-55_5x5.nc'] downloaded from ['']
- Selected year range 2022 to 2022
NOAAGlobalTemp
Original data file (external link)
Citations: Huang, B., M. J. Menne, T. Boyer, E. Freeman, B. E. Gleason, J. H. Lawrimore, C. Liu, J. J. Rennie, C. Schreck, F. Sun, R. Vose, C. N. Williams, X. Yin, H.-M. Zhang, 2020: Uncertainty estimates for sea surface temperature and land surface air temperature in NOAAGlobalTemp version 5. , J. Climate, 33, 1351-1379, DOI: 10.1175/JCLI-D-19-0395.1. Zhang, Huai-Min, Jay H. Lawrimore, Boyin Huang, Matthew J. Menne, Xungang Yin, Ahira Sȧnchez-Lugo, Byron E. Gleason, Russell Vose, Derek Arndt, J. Jared Rennie, and Claude N. Williams. (2019) Updated Temperature Data Give a Sharper View of Climate Trends. Eos, 100, https://doi.org/10.1029/2019EO128229.
Data citation: Zhang, H.-M., B. Huang, J. Lawrimore, M. Menne, Thomas M. Smith, NOAA Global Surface Temperature Dataset (NOAAGlobalTemp), Version 5 [indicate subset used]. NOAA National Centers for Environmental Information. doi:10.25921/9qth-2p70 Accessed [2023-02-16 09:22:15].
To produce the plot, the following processing steps were performed:
- Data set created from file ['NOAAGlobalTemp_v*.nc'] downloaded from ['https://www.ncei.noaa.gov/data/noaa-global-surface-temperature/v5/access/gridded/NOAAGlobalTemp_v.*.nc'] at ['2023-02-16 09:22:15']
- Rebaselined to 1991-2020
- Calculated annual average
- Wrote to file NOAAGlobalTemp_5x5.nc
- Gridded dataset created from file ['NOAAGlobalTemp_5x5.nc'] downloaded from ['']
- Selected year range 2022 to 2022
Temperature anomaly rank map
Global mean temperature is based on measurements made at weather stations over land and by ships and buoys over the ocean. Temperatures are typically expressed as anomalies which are temperature differences from the average for a standard period. Here, 1850-1900 is used for the global mean. Instrumental temperature records are some of the longest climate records available, with some series extending back to the 17th century.
The data in the above plot are available in a zip file containing a csv file for each data set.
Data file: Temperature_anomaly_rank_map_data_files.zip
Checksum: 76cdb2bad9582d23c1f6f4d868218d6c
Format: BADC CSV format
Berkeley Earth
Original data file (external link)
To produce the plot, the following processing steps were performed:
- Data set created from file ['Land_and_Ocean_LatLong1.nc'] downloaded from ['http://berkeleyearth.lbl.gov/auto/Global/Gridded/Land_and_Ocean_LatLong1.nc'] at ['2023-02-16 09:21:24']
- Regridded to 5 degree latitude-longitude resolution
- Rebaselined to 1991-2020
- Calculated annual average
- Wrote to file Berkeley Earth_5x5.nc
- Gridded dataset created from file ['Berkeley Earth_5x5.nc'] downloaded from ['']
- Selected year range 1850 to 2022
- Selected year range 2022 to 2022
ERA5
Original data file (external link)
Citations: Hersbach H, Bell B, Berrisford P et al. 2020. The ERA5 global reanalysis. Q. J. R. Meteorol. Soc. 146: 1999-2049. https://doi.org/10.1002/qj.3803. Bell, B., Hersbach, H., Simmons, A., Berrisford, P., Dahlgren, P., Horányi, A., et al. (2021) The ERA5 global reanalysis: Preliminary extension to 1950. Q J R Meteorol Soc, 147 741, 4186-4227. https://doi.org/10.1002/qj.4174.
To produce the plot, the following processing steps were performed:
- Gridded dataset created from file ['era5_2m_tas_YYYY.nc'] downloaded from ['extension']
- Regridded to 5 degree latitude-longitude resolution
- Rebaselined to 1991-2020
- Calculated annual average
- Wrote to file ERA5_5x5.nc
- Gridded dataset created from file ['ERA5_5x5.nc'] downloaded from ['']
- Selected year range 1850 to 2022
- Selected year range 2022 to 2022
GISTEMP
Original data file (external link)
Data citation: GISTEMP Team, 2022: GISS Surface Temperature Analysis (GISTEMP), version 4. NASA Goddard Institute for Space Studies. Dataset accessed 2023-02-16 09:22:04 at data.giss.nasa.gov/gistemp/.
To produce the plot, the following processing steps were performed:
- Data set created from file ['gistemp1200_GHCNv4_ERSSTv5.nc.gz'] downloaded from ['https://data.giss.nasa.gov/pub/gistemp/gistemp1200_GHCNv4_ERSSTv5.nc.gz'] at ['2023-02-16 09:22:04']
- Regridded to 5 degree latitude-longitude resolution
- Rebaselined to 1991-2020
- Calculated annual average
- Wrote to file GISTEMP_5x5.nc
- Gridded dataset created from file ['GISTEMP_5x5.nc'] downloaded from ['']
- Selected year range 1850 to 2022
- Selected year range 2022 to 2022
HadCRUT5
Original data file (external link)
Acknowledgement: HadCRUT.VVVV data were obtained from http://www.metoffice.gov.uk/hadobs/hadcrut5 on AAAA and are © British Crown Copyright, Met Office YYYY, provided under an Open Government License, http://www.nationalarchives.gov.uk/doc/open-government-licence/version/3/
To produce the plot, the following processing steps were performed:
- Gridded dataset created from file ['HadCRUT.5.0.1.0.analysis.anomalies.ensemble_mean.nc'] downloaded from ['https://www.metoffice.gov.uk/hadobs/hadcrut5/data/current/analysis/HadCRUT.5.0.1.0.analysis.anomalies.ensemble_mean.nc']
- Rebaselined to 1991-2020
- Calculated annual average
- Wrote to file HadCRUT5_5x5.nc
- Gridded dataset created from file ['HadCRUT5_5x5.nc'] downloaded from ['']
- Selected year range 1850 to 2022
- Selected year range 2022 to 2022
JRA-55
Original data file (external link)
To produce the plot, the following processing steps were performed:
- Data set created from file ['anl_surf125.011_tmp.202301_202312', 'anl_surf125.2023MMMM'] downloaded from ['', ''] at ['2023-01-09 09:22:14']
- Regridded to 5 degree latitude-longitude resolution
- Rebaselined to 1991-2020
- Calculated annual average
- Wrote to file JRA-55_5x5.nc
- Gridded dataset created from file ['JRA-55_5x5.nc'] downloaded from ['']
- Selected year range 1850 to 2022
- Selected year range 2022 to 2022
NOAAGlobalTemp
Original data file (external link)
Citations: Huang, B., M. J. Menne, T. Boyer, E. Freeman, B. E. Gleason, J. H. Lawrimore, C. Liu, J. J. Rennie, C. Schreck, F. Sun, R. Vose, C. N. Williams, X. Yin, H.-M. Zhang, 2020: Uncertainty estimates for sea surface temperature and land surface air temperature in NOAAGlobalTemp version 5. , J. Climate, 33, 1351-1379, DOI: 10.1175/JCLI-D-19-0395.1. Zhang, Huai-Min, Jay H. Lawrimore, Boyin Huang, Matthew J. Menne, Xungang Yin, Ahira Sȧnchez-Lugo, Byron E. Gleason, Russell Vose, Derek Arndt, J. Jared Rennie, and Claude N. Williams. (2019) Updated Temperature Data Give a Sharper View of Climate Trends. Eos, 100, https://doi.org/10.1029/2019EO128229.
Data citation: Zhang, H.-M., B. Huang, J. Lawrimore, M. Menne, Thomas M. Smith, NOAA Global Surface Temperature Dataset (NOAAGlobalTemp), Version 5 [indicate subset used]. NOAA National Centers for Environmental Information. doi:10.25921/9qth-2p70 Accessed [2023-02-16 09:22:15].
To produce the plot, the following processing steps were performed:
- Data set created from file ['NOAAGlobalTemp_v*.nc'] downloaded from ['https://www.ncei.noaa.gov/data/noaa-global-surface-temperature/v5/access/gridded/NOAAGlobalTemp_v.*.nc'] at ['2023-02-16 09:22:15']
- Rebaselined to 1991-2020
- Calculated annual average
- Wrote to file NOAAGlobalTemp_5x5.nc
- Gridded dataset created from file ['NOAAGlobalTemp_5x5.nc'] downloaded from ['']
- Selected year range 1850 to 2022
- Selected year range 2022 to 2022
Page created on 2023-03-03 using climind v0.1
