Sea Level
Introduction
The ocean covers nearly 70% of the Earth's surface. Most of the excess energy that accumulates in the Earth system due to increasing concentrations of greenhouse gases is taken up by the ocean. The added energy warms the ocean and this warming causes the water to expand, which in turn leads to sea-level rise. The melting of ice on the land also adds to sea level rise. The surface layers of the ocean have warmed more rapidly than the deeper interior, mirrored in the rise of global mean sea-surface temperature and in the increased incidence of marine heatwaves.
As the concentration of CO2 in the atmosphere increases, so too does the concentration of CO2 in the ocean. This affects ocean chemistry, lowering the average pH of the water, a process known as ocean acidification, though it should be noted that the ocean remains, on average, slightly alkaline. All these changes have a broad range of impacts and interactions in the ocean and coastal areas.
What the IPCC says
A1.6 It is virtually certain that the global upper ocean (0-700 m) has warmed since the 1970s and extremely likely that human influence is the main driver. It is virtually certain that human-caused CO2 emissions are the main driver of current global acidification of the surface open ocean. There is high confidence that oxygen levels have dropped in many upper ocean regions since the mid-20th century and medium confidence that human influence contributed to this drop.
A1.7 Global mean sea level increased by 0.20 [0.15 to 0.25] m between 1901 and 2018. The average rate of sea level rise was 1.3 [0.6 to 2.1] mm.yr-1 between 1901 and 1971, increasing to 1.9 [0.8 to 2.9] mm.yr-1 between 1971 and 2006, and further increasing to 3.7 [3.2 to 4.2] mm.yr-1 between 2006 and 2018 (high confidence). Human influence was very likely the main driver of these increases since at least 1971.
Chapter 2 Ocean pH has declined globally at the surface over the past four decades (virtually certain) and in all ocean basins in the ocean interior (high confidence) over the past 2-3 decades. A long-term increase in surface open ocean pH occurred over the past 50 million years (high confidence), and surface ocean pH as low as recent times is uncommon in the last 2 million years (medium confidence)
Chapter 9 Since the 1980s [marine heatwaves] have also become more intense and longer. Satellite observations and reanalyses of SST show an increase in intensity of 0.04°C per decade from 1982 to 2016, an increase in spatial extent of 19% per decade from 1982 to 2016, and an increase in annual MHW days of 54% between the 1987-2016 period compared to 1925-1954. The SROCC assessed that 84-90% of all MHWs that occurred between 2006 and 2015 are very likely caused by anthropogenic warming. There is new evidence since SROCC that the frequency of the most impactful marine heatwaves over the last few decades has increased more than 20-fold because of anthropogenic global warming. In summary, there is high confidence that MHWs have increased in frequency over the 20th century, with an approximate doubling from 1982 to 2016, and medium confidence that they have become more intense and longer since the 1980s
Key messages
Global mean sea level
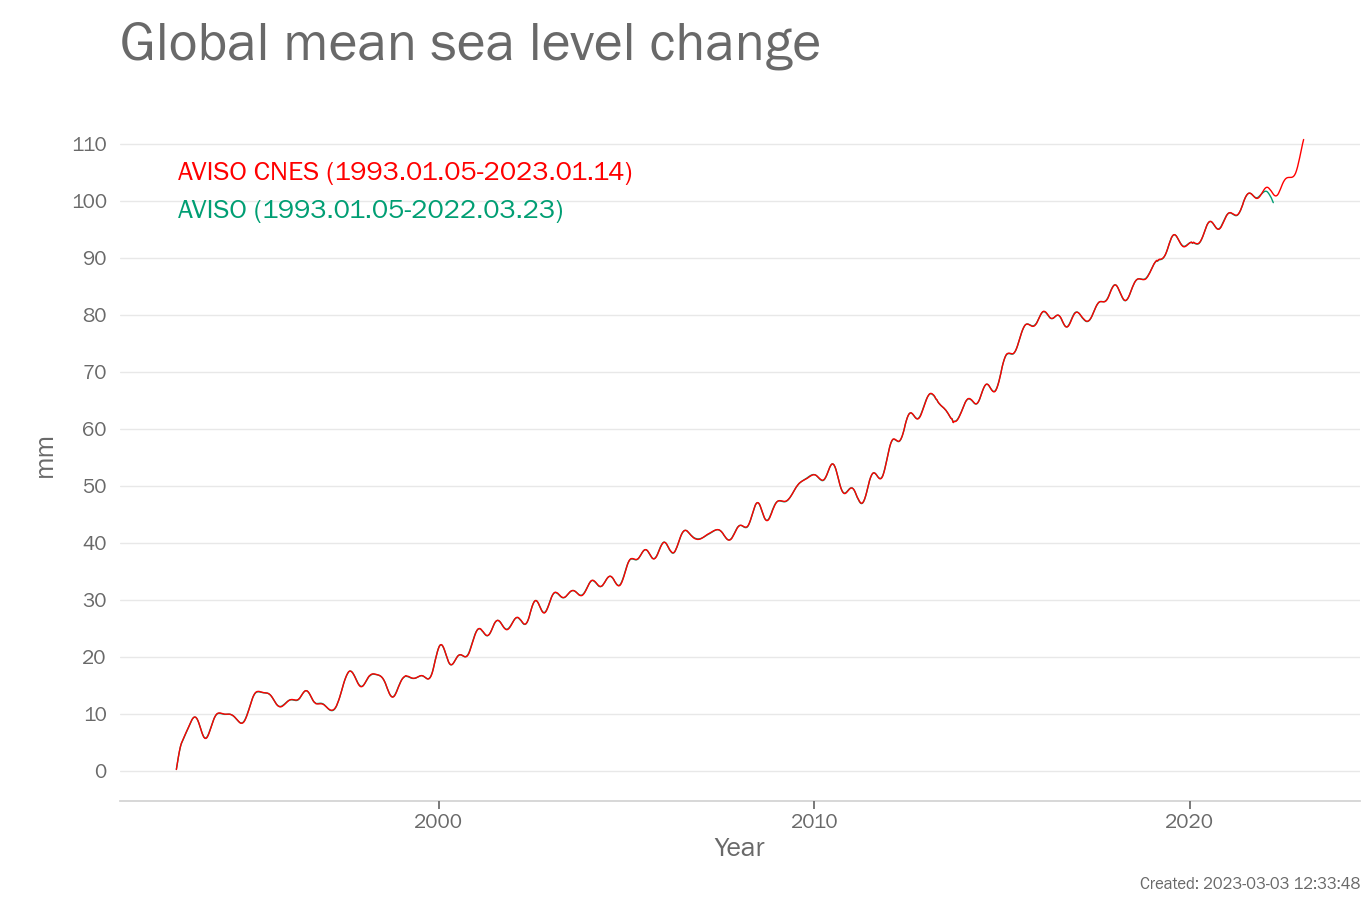
The rate of change in the AVISO data set is 3.3 mm/yr between 1993 and 2021.The rate of change in the AVISO CNES data set is 3.3 mm/yr between 1993 and 2021.
Global ocean heat content
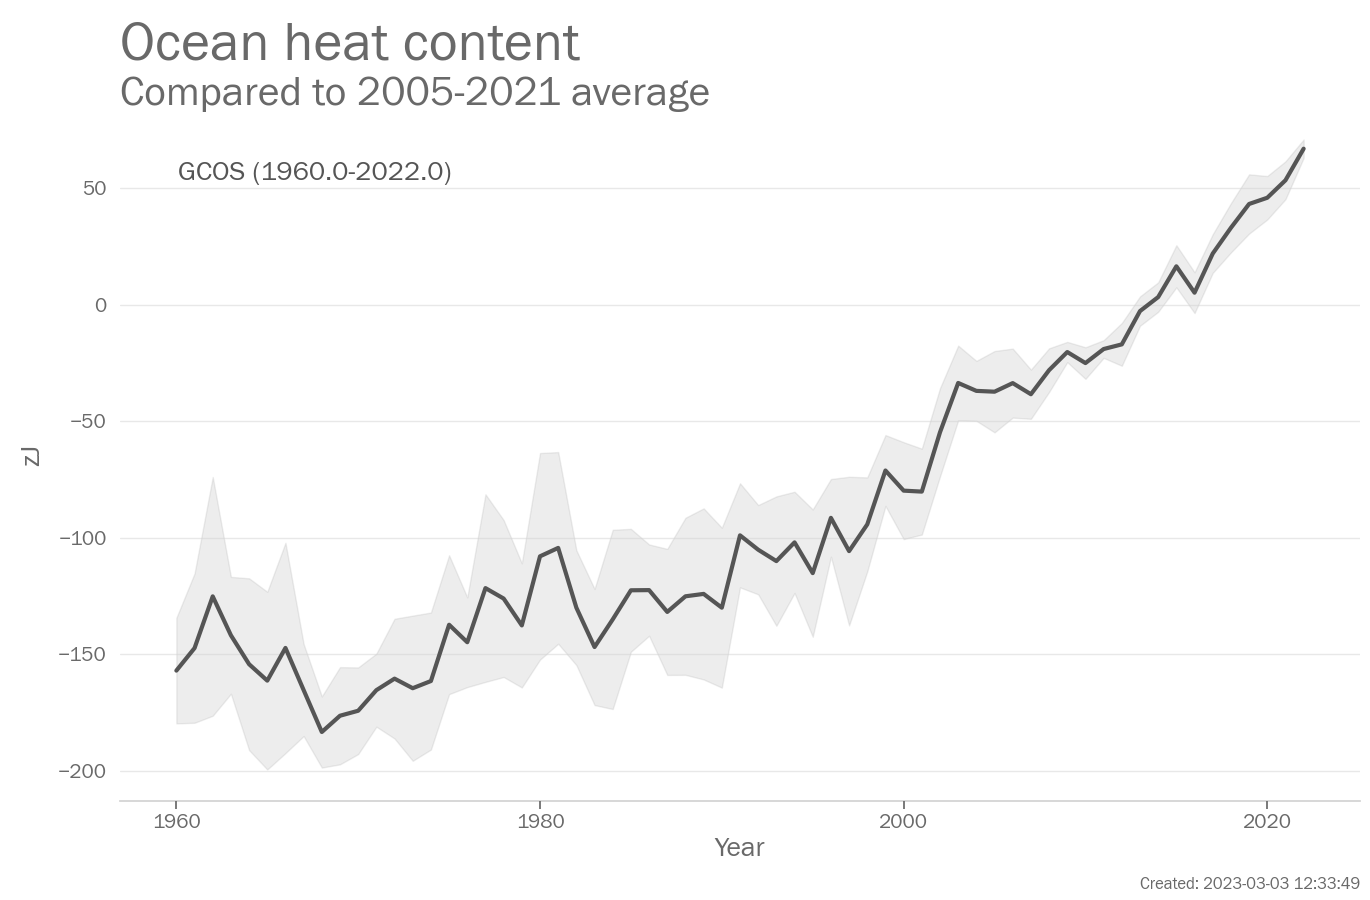
The year 2022 was ranked the 1st highest on record. The mean value for 2022 was 66.91zJ relative to the 2005-2021 average (66.91-66.91zJ depending on the data set used). 1 data sets were used in this assessment: GCOS.
The year 2021 was ranked the 2nd highest on record. The mean value for 2021 was 53.36zJ relative to the 2005-2021 average (53.36-53.36zJ depending on the data set used). 1 data sets were used in this assessment: GCOS.
Dataset and processing details
Sea level
Global mean sea level is a measured by satellites using radar altimeters that record the time taken for a radar signal to reach the sea-surface and return to the satellite. Longer records of sea level (not shown here) exist based on tide gauge measurements made along coastlines around the world since the late 19th century.
The data in the above plot are available in a zip file containing a csv file for each data set.
Data file: Sea_level_data_files.zip
Checksum: 1be0b0c2efd8740c3350990851a932ab
Format: BADC CSV format
AVISO
Original data file (external link)
Acknowledgement: Generated using AVISO+ Products
To produce the plot, the following processing steps were performed:
- Data set created from file ['GMSL_Aviso_Merged_NRTJ3_Ablain_drift_corrected_ts.txt'] downloaded from [''] at ['2022-07-29 17:40:00']
AVISO CNES
Original data file (external link)
Acknowledgement: Generated using AVISO+ Products
To produce the plot, the following processing steps were performed:
- Data set created from file ['MSL_Serie_MERGED_Global_AVISO_GIA_Adjust_Filter6m_NRT.nc'] downloaded from ['ftp://ftp.aviso.altimetry.fr/pub/oceano/AVISO/indicators/msl/MSL_Serie_MERGED_Global_AVISO_GIA_Adjust_Filter6m_NRT.nc'] at ['2023-02-27 09:15:21']
Ocean heat content
Ocean heat content is a measure of the change in heat energy stored in the subsurface ocean. It is based on temperature measurements made by research vessels (since the 1950s), moorings, and automated profiling floats (known as Argo floats) since the 2000s.
The data in the above plot are available in a zip file containing a csv file for each data set.
Data file: Ocean_heat_content_data_files.zip
Checksum: 1f9523b78a42a0bd83381e636642364a
Format: BADC CSV format
GCOS
Original data file (external link) Original data file (external link)
Data citation: von Schuckmann, Karina; Minière, Audrey; Gues, Flora; Cuesta-Valero, Francisco; Kirchengast, Gottfried; Adusumilli, Susheel; Straneo, Fiammetta; Allan, Richard; Barker, Paul M.; Beltrami, Hugo; Boyer, Tim; Cheng, Lijing; Church, John; Desbruyeres, Damien; Dolman, Han; Domingues, Catia; García-García, Almudena; Giglio, Donata; Gilson, John; Gorfer, Maximilian; Haimberger, Leopold; Hendricks, Stefan; Hosoda, Shigeki; Johnson, Gregory; Killick, Rachel; King, Brian; Kolodziejczyk, Nicolas; Korosov, Anton; Krinner, Gerhard; Kuusela, Mikael; Langer, Moritz; Lavergne, Thomas; Li, Yuehua; Lyman, John; Marzeion, Ben; Mayer, Michael; MacDougall, Andrew; Lawrence, Isobel; McDougall, Trevor; Monselesan, Didier; Nitzbon, Jean; Otosaka, Inès; Peng, Jian; Purkey, Sarah; Roemmich, Dean; Sato, Kanako; Sato, Katsunari; Savita, Abhishek; Schweiger, Axel; Shepherd, Andrew; Seneviratne, Sonia; Simons, Leon; Slater, Donald; Slater, Thomas; Smith, Noah; Steiner, Andrea; Suga, Toshio; Szekely, Tanguy; Thiery, Wim; Timmermanns, Mary-Louise; Vanderkelen, Inne; Wijffels, Susan; Wu, Tonghua; Zemp, Michael (2022). Heat stored in the Earth system 1960-2020: Where does the energy go?. World Data Center for Climate (WDCC) at DKRZ. https://www.wdc-climate.de/ui/entry?acronym=GCOS_EHI_1960-2020
To produce the plot, the following processing steps were performed:
- Data set created from file ['GCOS_EHI_1960-2020_Earth_Heat_Inventory_Ocean_Heat_Content_data.nc', 'WMO_global_OHC_60N60S_mean_spread_1960-2021_ZJ.nc'] downloaded from ['https://www.wdc-climate.de/WDCC/ui/download/transferArchive?acronym=GCOS_EHI_1960-2020_OHC_d&rmin=0&rmax=0', ''] at ['2023-02-13 17:48:00']
Sea-surface temperature
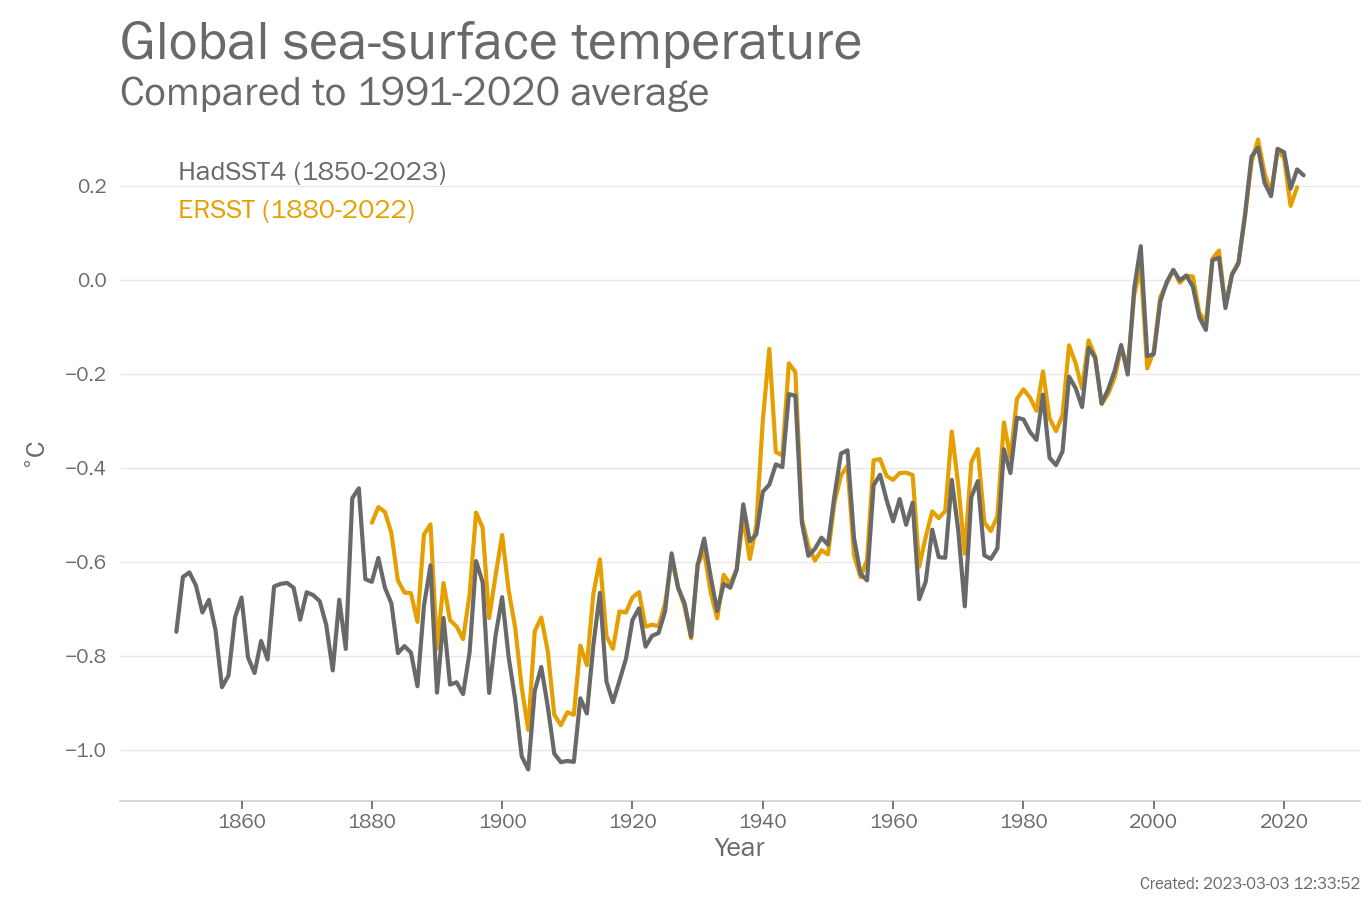
Sea-surface temperature (SST) is the temperature of the surface ocean, typically measured in the upper metre, or metres of the ocean, by ships, buoys and satellites.
The data in the above plot are available in a zip file containing a csv file for each data set.
Data file: Sea-surface_temperature_data_files.zip
Checksum: 7c30712012fa027e7a914867f6e93624
Format: BADC CSV format
ERSST
Original data file (external link) Original data file (external link)
Data citation: Boyin Huang, Peter W. Thorne, Viva F. Banzon, Tim Boyer, Gennady Chepurin, Jay H. Lawrimore, Matthew J. Menne, Thomas M. Smith, Russell S. Vose, and Huai-Min Zhang (2017): NOAA Extended Reconstructed Sea Surface Temperature (ERSST), Version 5. [indicate subset used]. NOAA National Centers for Environmental Information. doi:10.7289/V5T72FNM [2023-02-27 09:16:30].
To produce the plot, the following processing steps were performed:
- Data set created from file ['aravg.mon.ocean.90S.90N.v5.0.0.2023MMMM.asc', 'aravg.ann.ocean.90S.90N.v5.0.0.2023MMMM.asc'] downloaded from ['https://www.ncei.noaa.gov/data/noaa-global-surface-temperature/v5/access/timeseries/aravg.mon.ocean.90S.90N.v5.0.0.2023MMMM.asc', 'https://www.ncei.noaa.gov/data/noaa-global-surface-temperature/v5/access/timeseries/aravg.ann.ocean.90S.90N.v5.0.0.2023MMMM.asc'] at ['2023-02-27 09:16:30']
- Calculated annual average from monthly averages using arithmetic mean
- Rebaselined to 1991-2020 by subtracting the arithemtic mean for that period from all data values.
HadSST4
Original data file (external link) Original data file (external link)
Acknowledgement: HadSST.4.0.1.0 data were obtained from http://www.metoffice.gov.uk/hadobs/hadsst4 on 2023-02-27 09:17:44 and are © British Crown Copyright, Met Office 2023, provided under an Open Government License, http://www.nationalarchives.gov.uk/doc/open-government-licence/version/3/
To produce the plot, the following processing steps were performed:
- Data set created from file ['HadSST.4.0.1.0_monthly_GLOBE.csv', 'HadSST.4.0.1.0_annual_GLOBE.csv'] downloaded from ['https://www.metoffice.gov.uk/hadobs/hadsst4/data/csv/HadSST.4.0.1.0_monthly_GLOBE.csv', 'https://www.metoffice.gov.uk/hadobs/hadsst4/data/csv/HadSST.4.0.1.0_annual_GLOBE.csv'] at ['2023-02-27 09:17:44', '2023-02-27 09:17:44']
- Calculated annual average from monthly averages using arithmetic mean
- Rebaselined to 1991-2020 by subtracting the arithemtic mean for that period from all data values.
Page created on 2023-03-03 using climind v0.1


