Sea ice extent
Introduction
Sea ice is ice that floats on the surface of the ocean. It affects the transfer of heat, energy, momentum and gases between the atmosphere and ocean. Sea ice also plays an important role in many polar ecosystems. Sea-ice extent is a measure of the area of the ocean covered by sea ice.
Sea ice reflects sunlight and absorbs relatively little compared to dark ocean water. If sea ice cover is reduced, the surface absorbs far more sunlight and warms up. In turn the warming can reduce sea ice cover. This feedback is one reason that the Arctic has warmed faster than the global average.
The formation and persistence of sea ice is different in the northern and southern hemispheres. In the northern hemisphere, ice forms largely within the confines of the Arctic ocean, which is enclosed by the coasts of the northern land masses, and other partly enclosed seas. In the southern hemisphere, the ice forms around the edge of the Antarctic continent.
Because sea ice is floating ice, melting and growth of sea ice have little effect on sea level.
What the IPCC says
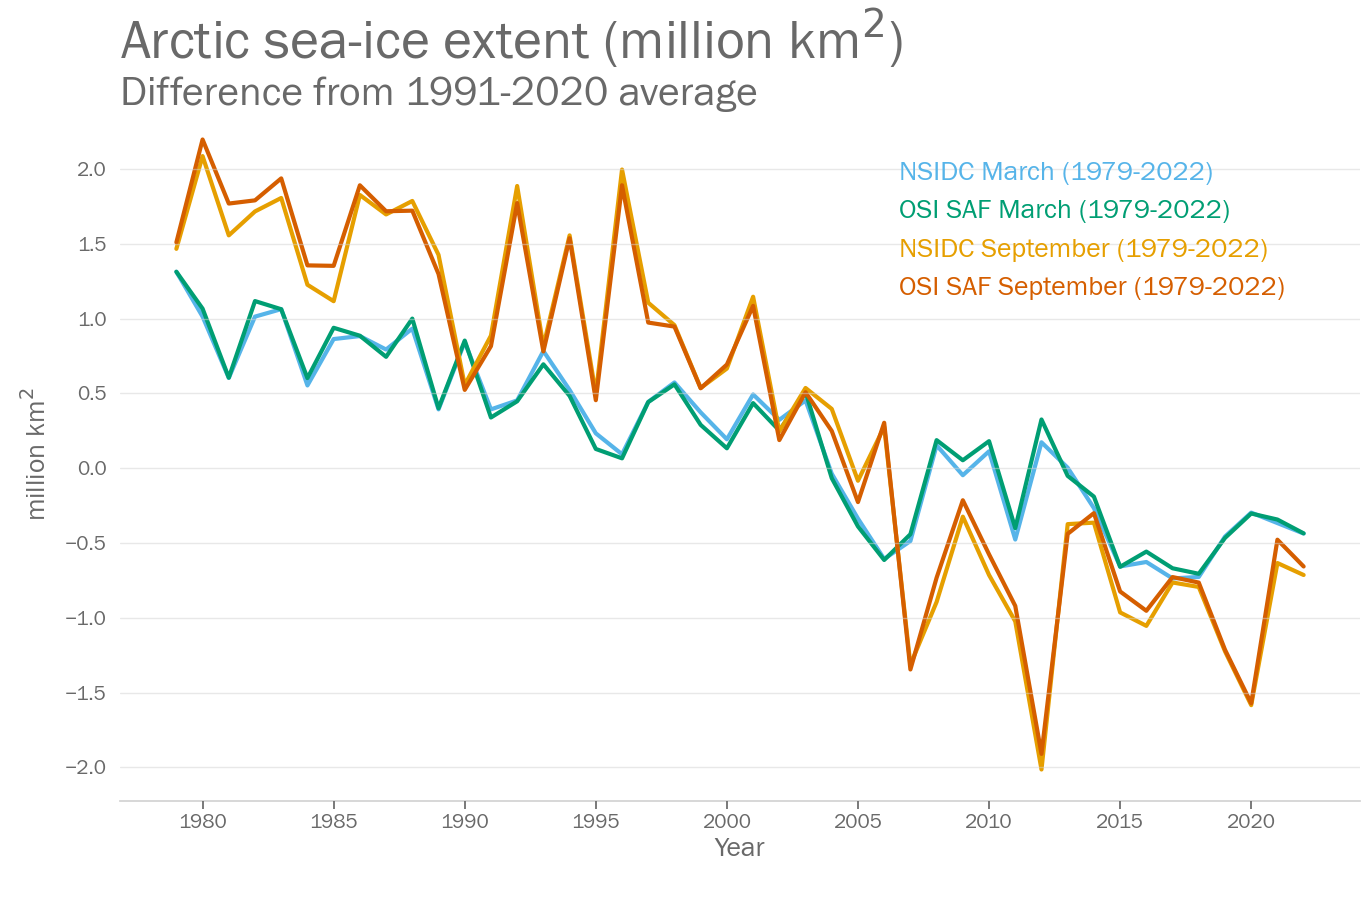
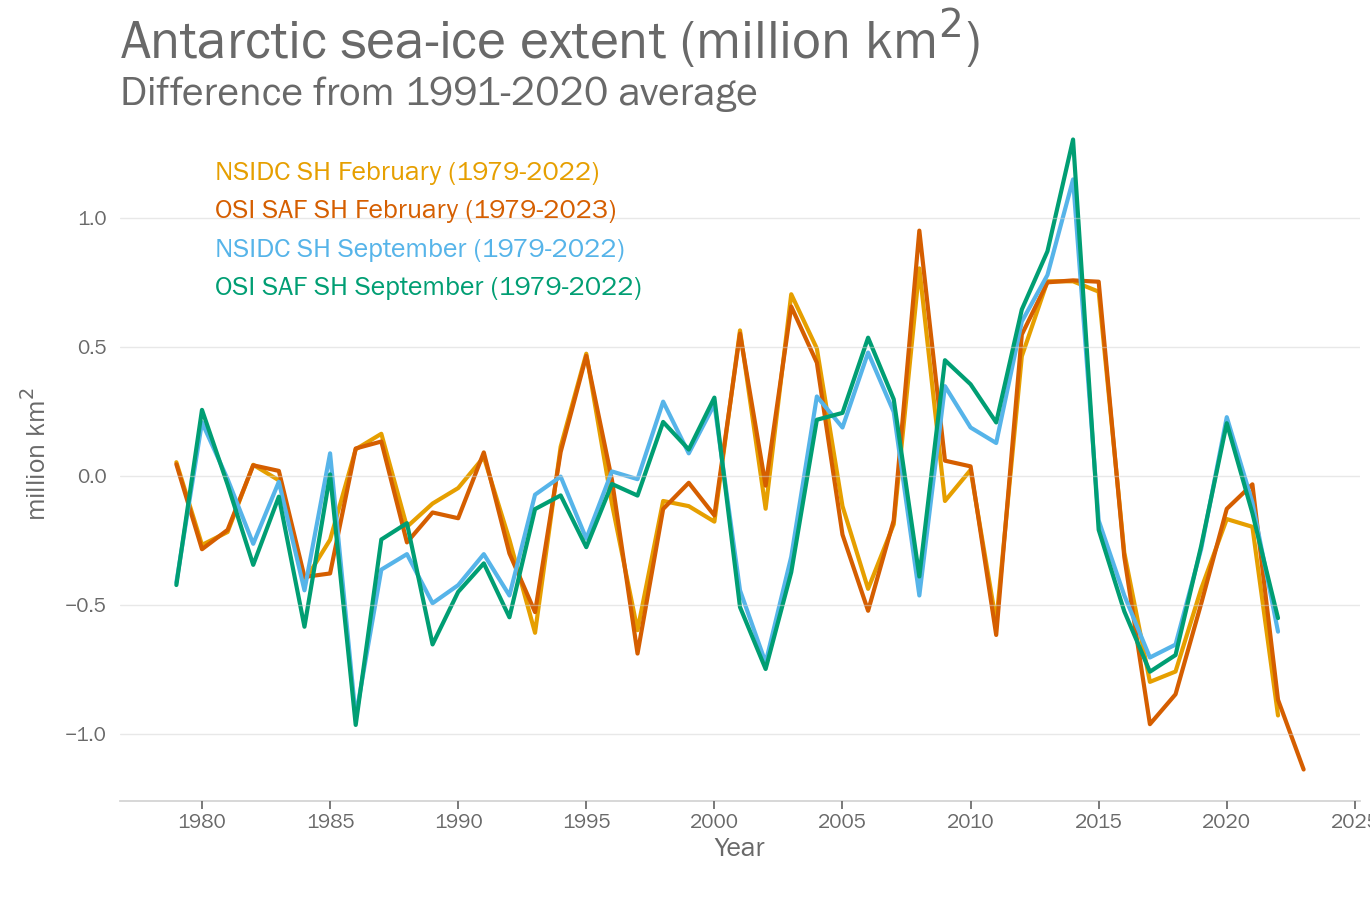
A1.5 Human influence is very likely the main driver of the global retreat of glaciers since the 1990s and the decrease in Arctic sea ice area between 1979-1988 and 2010-2019 (decreases of about 40% in September and about 10% in March). There has been no significant trend in Antarctic sea ice area from 1979 to 2020 due to regionally opposing trends and large internal variability.
Chapter 2 Current Arctic sea ice coverage levels are the lowest since at least 1850 for both annual mean and late-summer values (high confidence) and for the past 1000 years for late-summer values (medium confidence). Between 1979 and 2019, Arctic sea ice area has decreased in both summer and winter, with sea ice becoming younger, thinner and more dynamic (very high confidence). Decadal means for Arctic sea ice area decreased from 6.23 million km2 in 1979-1988 to 3.76 million km2 in 2010-2019 for September and from 14.52 to 13.42 million km2 for March. Antarctic sea ice area has experienced little net change since 1979 (high confidence), with only minor differences between sea ice area decadal means for 1979-1988 (2.04 million km2 for February, 15.39 million km2 for September) and 2010-2019 (2.17 million km2 for February, 15.75 million km2 for September)
Key messages
Arctic sea-ice extent
Arctic sea ice extent in March 2022 was between 14.59 and 14.70million km2. This was between the 8th and 9th lowest extent on record. In September the extent was between 4.87 and 5.39million km2. This was the 11th lowest extent on record. Data sets used were: NSIDC and OSI SAF
Antarctic sea-ice extent
Antarctic sea ice extent in February 2022 was between 2.16 and 2.51million km2. This was between the 1st and 3rd lowest extent on record. In September the extent was between 18.01 and 18.47million km2. This was between the 5th and 7th lowest extent on record. Data sets used were: NSIDC and OSI SAF
Dataset and processing details
Arctic sea ice
Sea-ice concentrations are estimated from microwave radiances measured from satellites (from 1979). Sea-ice extent is calculated as the area of ocean grid cells where the sea-ice concentration exceeds 15%. Although there are relatively large differences in the absolute extent between data sets, they agree well on the year-to-year changes and the trends.
The data in the above plot are available in a zip file containing a csv file for each data set.
Data file: Arctic_sea_ice_data_files.zip
Checksum: 2b9ddc462ec48a30c1d85a9cc99e0518
Format: BADC CSV format
NSIDC
Original data file (external link) Original data file (external link) Original data file (external link) Original data file (external link) Original data file (external link) Original data file (external link) Original data file (external link) Original data file (external link) Original data file (external link) Original data file (external link) Original data file (external link) Original data file (external link)
Data citation: Fetterer, F., K. Knowles, W. N. Meier, M. Savoie, and A. K. Windnagel. 2017, updated daily. Sea Ice Index, Version 3. 1979-present. Boulder, Colorado USA. NSIDC: National Snow and Ice Data Center. doi: https://doi.org/10.7265/N5K072F8. [2023-02-27 09:19:31].
Acknowledgement: Fetterer, F., K. Knowles, W. N. Meier, M. Savoie, and A. K. Windnagel. 2017, updated daily. Sea Ice Index, Version 3. 1979-present. Boulder, Colorado USA. NSIDC: National Snow and Ice Data Center. doi: https://doi.org/10.7265/N5K072F8. [2023-02-27 09:19:31].
To produce the plot, the following processing steps were performed:
- Data set created from file ['N_01_extent_v3.0.csv', 'N_02_extent_v3.0.csv', 'N_03_extent_v3.0.csv', 'N_04_extent_v3.0.csv', 'N_05_extent_v3.0.csv', 'N_06_extent_v3.0.csv', 'N_07_extent_v3.0.csv', 'N_08_extent_v3.0.csv', 'N_09_extent_v3.0.csv', 'N_10_extent_v3.0.csv', 'N_11_extent_v3.0.csv', 'N_12_extent_v3.0.csv'] downloaded from ['ftp://sidads.colorado.edu/DATASETS/NOAA/G02135/north/monthly/data/N_01_extent_v3.0.csv', 'ftp://sidads.colorado.edu/DATASETS/NOAA/G02135/north/monthly/data/N_02_extent_v3.0.csv', 'ftp://sidads.colorado.edu/DATASETS/NOAA/G02135/north/monthly/data/N_03_extent_v3.0.csv', 'ftp://sidads.colorado.edu/DATASETS/NOAA/G02135/north/monthly/data/N_04_extent_v3.0.csv', 'ftp://sidads.colorado.edu/DATASETS/NOAA/G02135/north/monthly/data/N_05_extent_v3.0.csv', 'ftp://sidads.colorado.edu/DATASETS/NOAA/G02135/north/monthly/data/N_06_extent_v3.0.csv', 'ftp://sidads.colorado.edu/DATASETS/NOAA/G02135/north/monthly/data/N_07_extent_v3.0.csv', 'ftp://sidads.colorado.edu/DATASETS/NOAA/G02135/north/monthly/data/N_08_extent_v3.0.csv', 'ftp://sidads.colorado.edu/DATASETS/NOAA/G02135/north/monthly/data/N_09_extent_v3.0.csv', 'ftp://sidads.colorado.edu/DATASETS/NOAA/G02135/north/monthly/data/N_10_extent_v3.0.csv', 'ftp://sidads.colorado.edu/DATASETS/NOAA/G02135/north/monthly/data/N_11_extent_v3.0.csv', 'ftp://sidads.colorado.edu/DATASETS/NOAA/G02135/north/monthly/data/N_12_extent_v3.0.csv'] at ['2023-02-27 09:19:31', '2023-02-27 09:19:32', '2023-02-27 09:19:33', '2023-02-27 09:19:34', '2023-02-27 09:19:35', '2023-02-27 09:19:36', '2023-02-27 09:19:38', '2023-02-27 09:19:39', '2023-02-27 09:19:40', '2023-02-27 09:19:41', '2023-02-27 09:19:42', '2023-02-27 09:19:43']
- Rebaselined to 1991-2020 for each month separately by calculating the arithmetic mean of the data over the baseline period and subtracting the mean from all data values. This is done for each month separately (Januarys, Februarys etc).
- Calculated annual series by extracting March from each year
- Calculated annual series by extracting September from each year
OSI SAF
Original data file (external link)
Data citation: EUMETSAT Ocean and Sea Ice Satellite Application Facility, Sea ice index 1979-onwards (v2.1, 2020), OSI-420, Data extracted from OSI SAF FTP server: 1979-present, Northern Hemisphere, accessed 2023-02-27 09:19:47
Acknowledgement: The OSI SAF Sea Ice Index v2.1 is made available at https://osisaf-hl.met.no/v2p1-sea-ice-index. The OSI SAF Sea Ice Index v2p1 is prepared using EUMETSAT OSI SAF Sea Ice Concentration data, with R&D input from the ESA Climate Change Initiative (ESA CCI) (Lavergne et al. 2019)
To produce the plot, the following processing steps were performed:
- Data set created from file ['osisaf_nh_sie_monthly.txt'] downloaded from ['ftp://osisaf.met.no/prod_test/ice/index/v2p1/nh/osisaf_nh_sie_monthly.txt'] at ['2023-02-27 09:19:47']
- Rebaselined to 1991-2020 for each month separately by calculating the arithmetic mean of the data over the baseline period and subtracting the mean from all data values. This is done for each month separately (Januarys, Februarys etc).
- Calculated annual series by extracting March from each year
- Calculated annual series by extracting September from each year
Antarctic sea ice
Sea-ice concentrations are estimated from microwave radiances measured from satellites (from 1979). Sea-ice extent is calculated as the area of ocean grid cells where the sea-ice concentration exceeds 15%. Although there are relatively large differences in the absolute extent between data sets, they agree well on the year-to-year changes and the trends.
The data in the above plot are available in a zip file containing a csv file for each data set.
Data file: Antarctic_sea_ice_data_files.zip
Checksum: b0005a9c93b0291f7d58fae75c9ea349
Format: BADC CSV format
NSIDC
Original data file (external link) Original data file (external link) Original data file (external link) Original data file (external link) Original data file (external link) Original data file (external link) Original data file (external link) Original data file (external link) Original data file (external link) Original data file (external link) Original data file (external link) Original data file (external link)
Data citation: Fetterer, F., K. Knowles, W. N. Meier, M. Savoie, and A. K. Windnagel. 2017, updated daily. Sea Ice Index, Version 3. 1979-present. Boulder, Colorado USA. NSIDC: National Snow and Ice Data Center. doi: https://doi.org/10.7265/N5K072F8. [2023-02-27 09:19:14].
Acknowledgement: Fetterer, F., K. Knowles, W. N. Meier, M. Savoie, and A. K. Windnagel. 2017, updated daily. Sea Ice Index, Version 3. 1979-present. Boulder, Colorado USA. NSIDC: National Snow and Ice Data Center. doi: https://doi.org/10.7265/N5K072F8. [2023-02-27 09:19:14].
To produce the plot, the following processing steps were performed:
- Data set created from file ['S_01_extent_v3.0.csv', 'S_02_extent_v3.0.csv', 'S_03_extent_v3.0.csv', 'S_04_extent_v3.0.csv', 'S_05_extent_v3.0.csv', 'S_06_extent_v3.0.csv', 'S_07_extent_v3.0.csv', 'S_08_extent_v3.0.csv', 'S_09_extent_v3.0.csv', 'S_10_extent_v3.0.csv', 'S_11_extent_v3.0.csv', 'S_12_extent_v3.0.csv'] downloaded from ['ftp://sidads.colorado.edu/DATASETS/NOAA/G02135/south/monthly/data/S_01_extent_v3.0.csv', 'ftp://sidads.colorado.edu/DATASETS/NOAA/G02135/south/monthly/data/S_02_extent_v3.0.csv', 'ftp://sidads.colorado.edu/DATASETS/NOAA/G02135/south/monthly/data/S_03_extent_v3.0.csv', 'ftp://sidads.colorado.edu/DATASETS/NOAA/G02135/south/monthly/data/S_04_extent_v3.0.csv', 'ftp://sidads.colorado.edu/DATASETS/NOAA/G02135/south/monthly/data/S_05_extent_v3.0.csv', 'ftp://sidads.colorado.edu/DATASETS/NOAA/G02135/south/monthly/data/S_06_extent_v3.0.csv', 'ftp://sidads.colorado.edu/DATASETS/NOAA/G02135/south/monthly/data/S_07_extent_v3.0.csv', 'ftp://sidads.colorado.edu/DATASETS/NOAA/G02135/south/monthly/data/S_08_extent_v3.0.csv', 'ftp://sidads.colorado.edu/DATASETS/NOAA/G02135/south/monthly/data/S_09_extent_v3.0.csv', 'ftp://sidads.colorado.edu/DATASETS/NOAA/G02135/south/monthly/data/S_10_extent_v3.0.csv', 'ftp://sidads.colorado.edu/DATASETS/NOAA/G02135/south/monthly/data/S_11_extent_v3.0.csv', 'ftp://sidads.colorado.edu/DATASETS/NOAA/G02135/south/monthly/data/S_12_extent_v3.0.csv'] at ['2023-02-27 09:19:14', '2023-02-27 09:19:15', '2023-02-27 09:19:16', '2023-02-27 09:19:17', '2023-02-27 09:19:19', '2023-02-27 09:19:20', '2023-02-27 09:19:21', '2023-02-27 09:19:22', '2023-02-27 09:19:23', '2023-02-27 09:19:24', '2023-02-27 09:19:26', '2023-02-27 09:19:27']
- Rebaselined to 1991-2020 for each month separately by calculating the arithmetic mean of the data over the baseline period and subtracting the mean from all data values. This is done for each month separately (Januarys, Februarys etc).
- Calculated annual series by extracting February from each year
- Calculated annual series by extracting September from each year
OSI SAF
Original data file (external link)
Data citation: EUMETSAT Ocean and Sea Ice Satellite Application Facility, Sea ice index 1979-onwards (v2.1, 2020), OSI-420, Data extracted from OSI SAF FTP server: 1979-present, Northern Hemisphere, accessed 2023-02-27 09:19:47
Acknowledgement: The OSI SAF Sea Ice Index v2.1 is made available at https://osisaf-hl.met.no/v2p1-sea-ice-index. The OSI SAF Sea Ice Index v2p1 is prepared using EUMETSAT OSI SAF Sea Ice Concentration data, with R&D input from the ESA Climate Change Initiative (ESA CCI) (Lavergne et al. 2019)
To produce the plot, the following processing steps were performed:
- Data set created from file ['osisaf_sh_sie_monthly.txt'] downloaded from ['ftp://osisaf.met.no/prod_test/ice/index/v2p1/sh/osisaf_sh_sie_monthly.txt'] at ['2023-02-27 09:19:47']
- Rebaselined to 1991-2020 for each month separately by calculating the arithmetic mean of the data over the baseline period and subtracting the mean from all data values. This is done for each month separately (Januarys, Februarys etc).
- Calculated annual series by extracting February from each year
- Calculated annual series by extracting September from each year
Sea-surface temperature
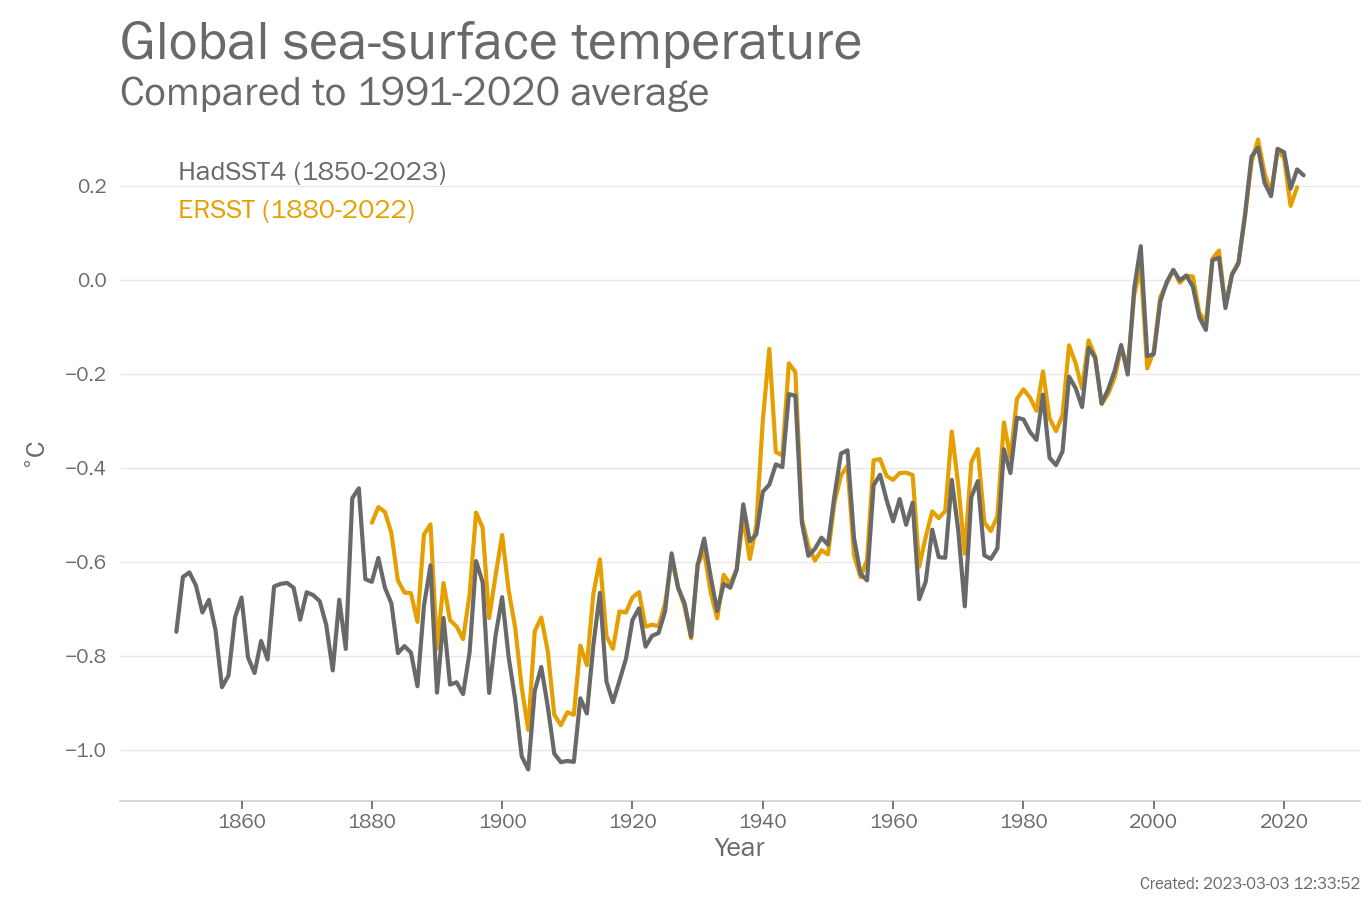
Sea-surface temperature (SST) is the temperature of the surface ocean, typically measured in the upper metre, or metres of the ocean, by ships, buoys and satellites.
The data in the above plot are available in a zip file containing a csv file for each data set.
Data file: Sea-surface_temperature_data_files.zip
Checksum: ebcffbedafad2846e3d62535897eee99
Format: BADC CSV format
ERSST
Original data file (external link) Original data file (external link)
Data citation: Boyin Huang, Peter W. Thorne, Viva F. Banzon, Tim Boyer, Gennady Chepurin, Jay H. Lawrimore, Matthew J. Menne, Thomas M. Smith, Russell S. Vose, and Huai-Min Zhang (2017): NOAA Extended Reconstructed Sea Surface Temperature (ERSST), Version 5. [indicate subset used]. NOAA National Centers for Environmental Information. doi:10.7289/V5T72FNM [2023-02-27 09:16:30].
To produce the plot, the following processing steps were performed:
- Data set created from file ['aravg.mon.ocean.90S.90N.v5.0.0.2023MMMM.asc', 'aravg.ann.ocean.90S.90N.v5.0.0.2023MMMM.asc'] downloaded from ['https://www.ncei.noaa.gov/data/noaa-global-surface-temperature/v5/access/timeseries/aravg.mon.ocean.90S.90N.v5.0.0.2023MMMM.asc', 'https://www.ncei.noaa.gov/data/noaa-global-surface-temperature/v5/access/timeseries/aravg.ann.ocean.90S.90N.v5.0.0.2023MMMM.asc'] at ['2023-02-27 09:16:30']
- Calculated annual average from monthly averages using arithmetic mean
- Rebaselined to 1991-2020 by subtracting the arithemtic mean for that period from all data values.
HadSST4
Original data file (external link) Original data file (external link)
Acknowledgement: HadSST.4.0.1.0 data were obtained from http://www.metoffice.gov.uk/hadobs/hadsst4 on 2023-02-27 09:17:44 and are © British Crown Copyright, Met Office 2023, provided under an Open Government License, http://www.nationalarchives.gov.uk/doc/open-government-licence/version/3/
To produce the plot, the following processing steps were performed:
- Data set created from file ['HadSST.4.0.1.0_monthly_GLOBE.csv', 'HadSST.4.0.1.0_annual_GLOBE.csv'] downloaded from ['https://www.metoffice.gov.uk/hadobs/hadsst4/data/csv/HadSST.4.0.1.0_monthly_GLOBE.csv', 'https://www.metoffice.gov.uk/hadobs/hadsst4/data/csv/HadSST.4.0.1.0_annual_GLOBE.csv'] at ['2023-02-27 09:17:44', '2023-02-27 09:17:44']
- Calculated annual average from monthly averages using arithmetic mean
- Rebaselined to 1991-2020 by subtracting the arithemtic mean for that period from all data values.
Page created on 2023-03-03 using climind v0.1


