Glaciers and Ice Sheets

Greenland ice sheet
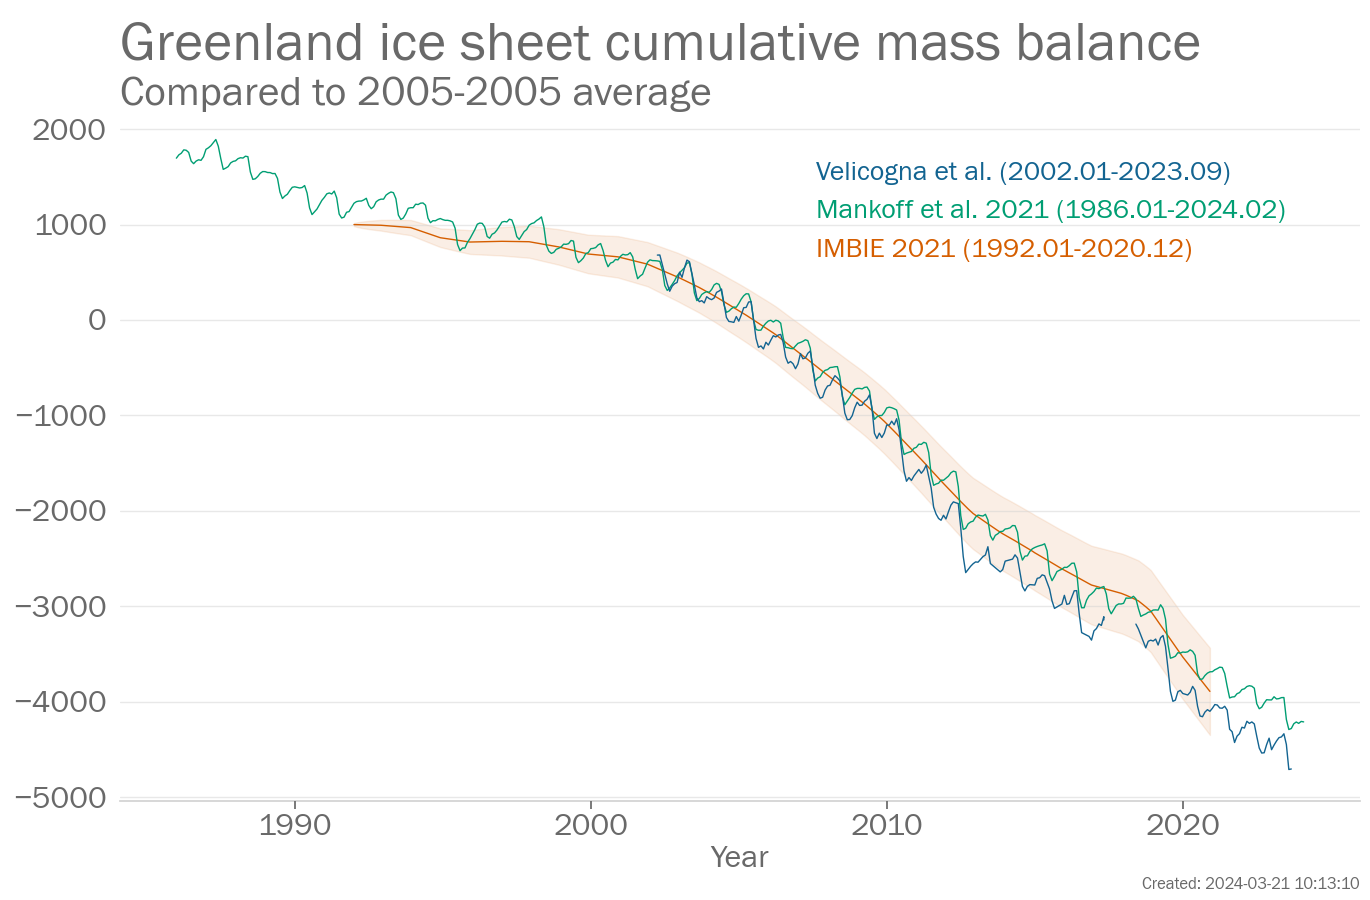
Monthly Greenland ice sheet cumulative mass balance (Gt, difference from the 2005-2005 average) from 1986-2024. Data are from the following three data sets: IMBIE 2021, Mankoff et al. 2021, Velicogna et al..
Introduction
Glaciers are formed by snow that falls and compacts into solid ice. The ice can flow downhill and where it reaches warmer altitudes, or reaches the sea, the ice can melt or break off in chunks. Large continuously glaciated areas are known as ice sheets. Currently, there are two ice sheets found on Greenland and Antarctica.
Observations and measurements of glaciers and ice sheets shown that they have been losing mass in the past few decades.
What the IPCC says
A1.5 Human influence is very likely the main driver of the global retreat of glaciers since the 1990s and the decrease in Arctic sea ice area between 1979-1988 and 2010-2019 (decreases of about 40% in September and about 10% in March). There has been no significant trend in Antarctic sea ice area from 1979 to 2020 due to regionally opposing trends and large internal variability. Human influence very likely contributed to the decrease in Northern Hemisphere spring snow cover since 1950. It is very likely that human influence has contributed to the observed surface melting of the Greenland Ice Sheet over the past two decades, but there is only limited evidence, with medium agreement, of human influence on the Antarctic Ice Sheet mass loss.
Key messages
Mountain glacier cumulative mass balance
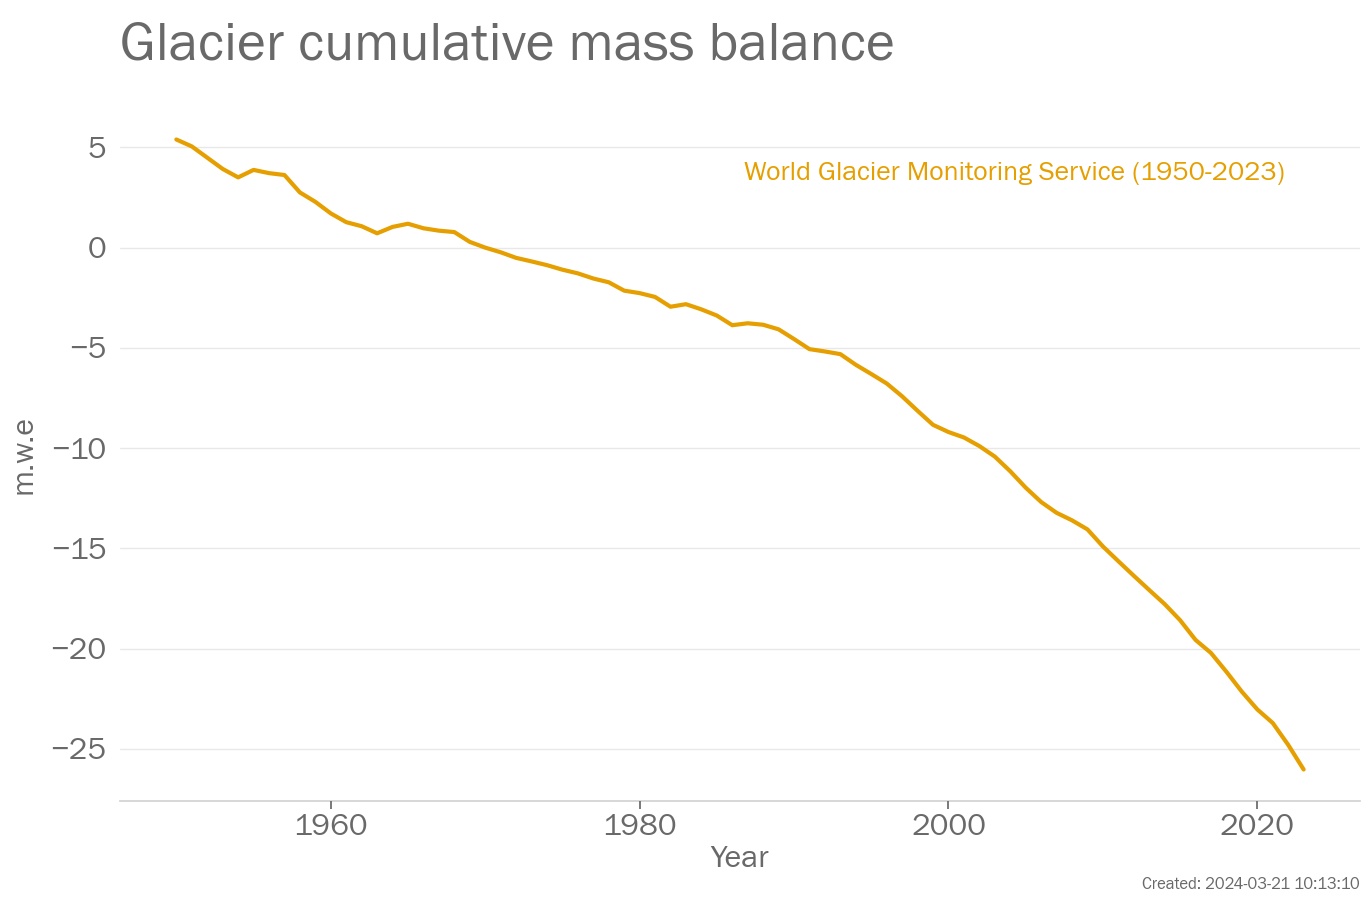
This was the 36th consecutive year of negative mass balance since 1988. Cumulative glacier loss since 1970 is -26.0m w.e..
Paragraph updated: 2024-03-21 10:13
Greenland ice sheet cumulative mass balance
In the Mankoff et al. 2021 data set, the mass change between September 2022 and August 2023 was -217.76Gt, which is a smaller loss than the average for 2005-2022 of -233.77Gt.
Paragraph updated: 2024-03-21 10:13
Greenland ice sheet cumulative mass balance
In the Velicogna et al. data set of Greenland ice sheet cumulative mass balance, the mass change between September 2022 and August 2023 was -196Gt.
Paragraph updated: 2024-03-21 10:13
Antarctic ice sheet cumulative mass balance
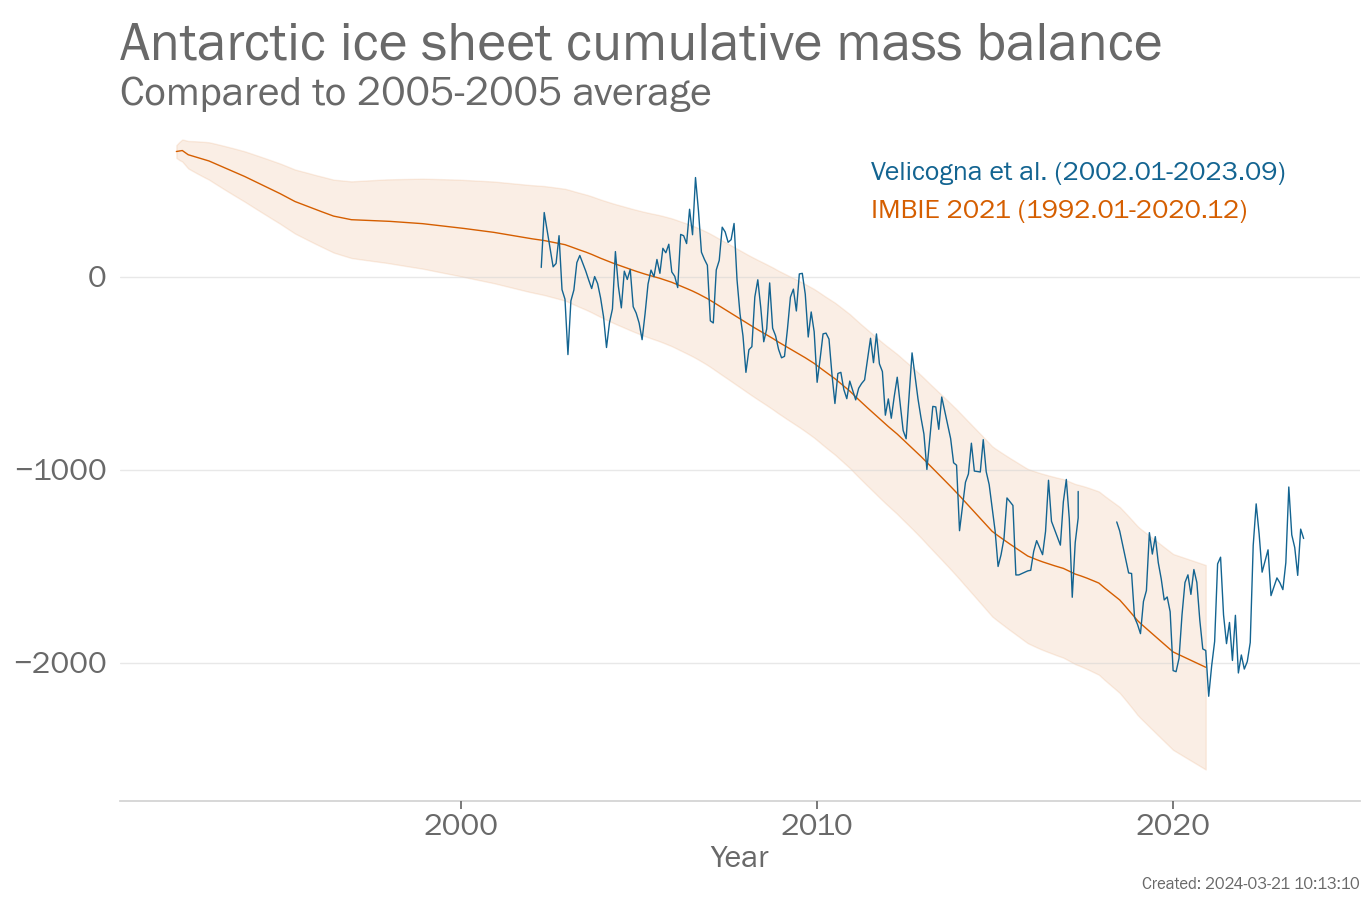
In the Velicogna et al. data set of Antarctic ice sheet cumulative mass balance, the mass change between September 2022 and August 2023 was 112Gt.
Paragraph updated: 2024-03-21 10:13
Dataset and processing details
Glacier mass balance
Glaciers are measured using a variety of different techniques. Glacier mass balance data for the global network of reference glaciers are available from the World Glacier Monitoring Service (WGMS), https://www.wgms.ch.
The data in the above plot are available in a zip file containing a csv file for each data set.
Data file: Glacier_mass_balance_data_files.zip
Checksum: 1477ee52216cadf0024f157354aede45
Format: BADC CSV format
World Glacier Monitoring Service
Original data file (external link)
Citation:
Data citation: WGMS (2017, updated, and earlier reports): Global Glacier Change Bulletin No. 2 (2014-2015). Zemp, M., Nussbaumer, S. U., Gärtner-Roer, I., Huber, J., Machguth, H., Paul, F., and Hoelzle, M. (eds.), ICSU(WDS)/IUGG(IACS)/UNEP/UNESCO/WMO, World Glacier Monitoring Service, Zurich, Switzerland, 244 pp., based on database version: doi:10.5904/wgms-fog-2018-11.
To produce the plot, the following processing steps were performed:
- Data set created from file ['mb_ref.csv'] downloaded from ['http://wgms.ch/data/faq/mb_ref.csv'] at ['2024-02-12 14:12:31']
Greenland ice sheet
The Greenland ice sheet mass balance measures the change in ice mass of the Greenland ice sheet. The change in mass is estimated in three principle ways: gravimetric measurements, altimetric measurements and the input-output method. Gravimetric measurements infer mass changes from variations in the Earth's gravitational field as measured by the GRACE and GRACE-FO (Gravity Recovery and Climate Experiment - Follow On) satellites. Altimetric measurements, measured the height of the ice sheet surface, using radar and laser altimeters. Input-output methods, use weather conditions from a numerical weather prediction model, to estimate changes in mass balance at the surface of the ice sheet. These are combined with estimates of mass loss from glaciers around the edge of Greenland and melting on the underside of the glaciers. The IMBIE data set combines over 25 different estimates of Greenland mass balance to get a comprehensive view of the long-term changes.
The data in the above plot are available in a zip file containing a csv file for each data set.
Data file: Greenland_ice_sheet_data_files.zip
Checksum: 7c8e13ae18274b6fc8b7c7d41e996be8
Format: BADC CSV format
IMBIE 2021
Original data file (external link)
Citation:
Data citation: Shepherd, A., Ivins, E., Rignot, E., Smith, B., van den Broeke, M., Velicogna, I., Whitehouse, P., Briggs, K., Joughin, I., Krinner, G., Nowicki, S., Payne, A., Scambos, T., Schlegel, N., A, G., Agosta, C., Ahlstrøm, A., Babonis, G., Barletta, V., … Wuite, J. (2021). Antarctic and Greenland Ice Sheet mass balance 1992-2020 for IPCC AR6 (Version 1.0) [Data set]. UK Polar Data Centre, Natural Environment Research Council, UK Research & Innovation. https://doi.org/10.5285/77B64C55-7166-4A06-9DEF-2E400398E452
To produce the plot, the following processing steps were performed:
- Data set created from file ['imbie_greenland_2021_Gt.csv'] downloaded from ['https://ramadda.data.bas.ac.uk/repository/entry/get/imbie_greenland_2021_Gt.csv?entryid=synth%3A77b64c55-7166-4a06-9def-2e400398e452%3AL2ltYmllX2dyZWVubGFuZF8yMDIxX0d0LmNzdg%3D%3D'] at ['2023-08-07 14:40:20']
- Zeroed series on July 2005 by subtracting the value for that month from all data values (see next entry)
- Added offset of 1000.3866 to all data values.
- Manually changed baseline to 2005-2005. Note that data values remain unchanged.
Mankoff et al. 2021
Original data file (external link)
Citation:
Data citation: https://doi.org/10.22008/FK2/OHI23Z
Notes: Filename should be MB_SMB_D_BMB.csv
To produce the plot, the following processing steps were performed:
- Data set created from file ['MB_SMB_D_BMB.csv'] downloaded from ['https://dataverse.geus.dk/api/access/datafile/'] at ['2024-02-13 13:56:31']
- Zeroed series on July 2005 by subtracting the value for that month from all data values (see next entry)
- Added offset of 1659.361539 to all data values.
- Manually changed baseline to 2005-2005. Note that data values remain unchanged.
Velicogna et al.
Original data file (external link)
Citations:
- Geruo, A., Wahr, J., & Zhong, S. (2013). Computations of the viscoelastic response of a 3-D compressible Earth to surface loading: An application to Glacial Isostatic Adjustment in Antarctica and Canada. Geophysical Journal International, 192(2), 557–572.
- Ivins, E. R., T. S. James, J. Wahr, E. J. O Schrama, F. W. Landerer, and K. M. Simon (2013), Antarctic contribution to sea level rise observed by GRACE with improved GIA correction, J. Geophys. Res. Solid Earth, 118, 3126–3141, doi:10.1002/jgrb.50208.
- Loomis, B. D., Rachlin, K. E., & Luthcke, S. B. (2019). Improved Earth oblateness rate reveals increased ice sheet losses and mass-driven sea level rise. Geophysical Research Letters, 46, 6910–6917. https://doi.org/10.1029/2019GL082929.
- Peltier, W., Argus, D., & Drummond, R. (2015). Space geodesy constrains ice age terminal deglaciation: The global ICE-6G_C (VM5a) model. Journal of Geophysical Research: Solid Earth, 120, 450–487. https://doi.org/10.1002/2014JB011176.
- Simpson, M. J., Milne, G. A., Huybrechts, P., & Long, A. J. (2009). Calibrating a glaciological model of the Greenland ice sheet from the Last Glacial Maximum to present-day using field observations of relative sea level and ice extent. Quaternary Science Reviews, 28(17), 1631–1657.
- Sutterley, T. C., & Velicogna, I. (2019). Improved estimates of geocenter variability from time-variable gravity and ocean model outputs. Remote Sensing, 11(18), 2108.
- Velicogna I., Mohajerani Y., A G., Landerer F., Mouginot J., Noel B., Rignot E., Sutterley T., van den Broeke M., van Wessem J., Wiese D. (2020). Continuity of ice sheet mass loss in Greenland and Antarctica from the GRACE and GRACE Follow-On missions, Geophys. Res. Lett. 47, e2020GL087291.
Notes: Gravimetric (GRACE) ice mass time series for the Greenland and Antarctic Ice Sheets are calculated using spherical harmonics from JPL RL06v1, following Velicogna et al (2020). The degree-1 geocentre terms are calculated using Sutterley and Velicogna (2019), using Loomis et al (2020) C2.0 and C3.0 coefficients. The GRACE/GRACE-FO data are corrected for the long-term trend of glacial isostatic adjustment (GIA) from the solid earth using the regional IJ05 R2 GIA model (Ivins et al., 2013) over Antarctica and the regional Simpson et al. (2009) GIA model over Greenland. These regional GIA models do not include realistic GIA signal outside the ice sheets. For this reason, outside of Greenland and Antarctica, GIA corrections are based on Geruou et al. (2013) with the ICE6G ice history (Peltier et al., 2015).
To produce the plot, the following processing steps were performed:
- Data set created from file ['out_ts_filled_4_261_GIS.txt'] downloaded from [''] at ['2024-02-28 15:05:54']
- Zeroed series on July 2005 by subtracting the value for that month from all data values (see next entry)
- Added offset of -1982.552 to all data values.
- Manually changed baseline to 2005-2005. Note that data values remain unchanged.
Antarctic ice sheet
The Antarctic ice sheet mass balance measures the change in ice mass of the Antarctic ice sheet. The change in mass is estimated in three principle ways: gravimetric measurements, altimetric measurements and the input-output method. Gravimetric measurements infer mass changes from variations in the Earth's gravitational field as measured by the GRACE and GRACE-FO (Gravity Recovery and Climate Experiment - Follow On) satellites. Altimetric measurements, measured the height of the ice sheet surface, using radar and laser altimeters. Input-output methods, use weather conditions from a numerical weather prediction model, to estimate changes in mass balance at the surface of the ice sheet. These are combined with estimates of mass loss from glaciers around the edge of the continent and melting on the underside of the glaciers. The IMBIE data set combines many estimates of Antarctic mass balance to get a comprehensive view of the long-term changes.
The data in the above plot are available in a zip file containing a csv file for each data set.
Data file: Antarctic_ice_sheet_data_files.zip
Checksum: bdd1ee1b480dbfdb9c5ee3aa6b421b06
Format: BADC CSV format
IMBIE 2021
Original data file (external link)
Citation:
Data citation: Shepherd, A., Ivins, E., Rignot, E., Smith, B., van den Broeke, M., Velicogna, I., Whitehouse, P., Briggs, K., Joughin, I., Krinner, G., Nowicki, S., Payne, A., Scambos, T., Schlegel, N., A, G., Agosta, C., Ahlstrøm, A., Babonis, G., Barletta, V., … Wuite, J. (2021). Antarctic and Greenland Ice Sheet mass balance 1992-2020 for IPCC AR6 (Version 1.0) [Data set]. UK Polar Data Centre, Natural Environment Research Council, UK Research & Innovation. https://doi.org/10.5285/77B64C55-7166-4A06-9DEF-2E400398E452
To produce the plot, the following processing steps were performed:
- Data set created from file ['imbie_antarctica_2021_Gt.csv'] downloaded from ['https://ramadda.data.bas.ac.uk/repository/entry/get/imbie_antarctica_2021_Gt.csv?entryid=synth%3A77b64c55-7166-4a06-9def-2e400398e452%3AL2ltYmllX2FudGFyY3RpY2FfMjAyMV9HdC5jc3Y%3D'] at ['2023-08-07 14:40:19']
- Zeroed series on June 2005 by subtracting the value for that month from all data values (see next entry)
- Added offset of 646.1411 to all data values.
- Manually changed baseline to 2005-2005. Note that data values remain unchanged.
Velicogna et al.
Original data file (external link)
Citations:
- Geruo, A., Wahr, J., & Zhong, S. (2013). Computations of the viscoelastic response of a 3-D compressible Earth to surface loading: An application to Glacial Isostatic Adjustment in Antarctica and Canada. Geophysical Journal International, 192(2), 557–572.
- Ivins, E. R., T. S. James, J. Wahr, E. J. O Schrama, F. W. Landerer, and K. M. Simon (2013), Antarctic contribution to sea level rise observed by GRACE with improved GIA correction, J. Geophys. Res. Solid Earth, 118, 3126–3141, doi:10.1002/jgrb.50208.
- Loomis, B. D., Rachlin, K. E., & Luthcke, S. B. (2019). Improved Earth oblateness rate reveals increased ice sheet losses and mass-driven sea level rise. Geophysical Research Letters, 46, 6910–6917. https://doi.org/10.1029/2019GL082929.
- Peltier, W., Argus, D., & Drummond, R. (2015). Space geodesy constrains ice age terminal deglaciation: The global ICE-6G_C (VM5a) model. Journal of Geophysical Research: Solid Earth, 120, 450–487. https://doi.org/10.1002/2014JB011176.
- Simpson, M. J., Milne, G. A., Huybrechts, P., & Long, A. J. (2009). Calibrating a glaciological model of the Greenland ice sheet from the Last Glacial Maximum to present-day using field observations of relative sea level and ice extent. Quaternary Science Reviews, 28(17), 1631–1657.
- Sutterley, T. C., & Velicogna, I. (2019). Improved estimates of geocenter variability from time-variable gravity and ocean model outputs. Remote Sensing, 11(18), 2108.
- Velicogna I., Mohajerani Y., A G., Landerer F., Mouginot J., Noel B., Rignot E., Sutterley T., van den Broeke M., van Wessem J., Wiese D. (2020). Continuity of ice sheet mass loss in Greenland and Antarctica from the GRACE and GRACE Follow-On missions, Geophys. Res. Lett. 47, e2020GL087291.
Notes: Gravimetric (GRACE) ice mass time series for the Greenland and Antarctic Ice Sheets are calculated using spherical harmonics from JPL RL06v1, following Velicogna et al (2020). The degree-1 geocentre terms are calculated using Sutterley and Velicogna (2019), using Loomis et al (2020) C2.0 and C3.0 coefficients. The GRACE/GRACE-FO data are corrected for the long-term trend of glacial isostatic adjustment (GIA) from the solid earth using the regional IJ05 R2 GIA model (Ivins et al., 2013) over Antarctica and the regional Simpson et al. (2009) GIA model over Greenland. These regional GIA models do not include realistic GIA signal outside the ice sheets. For this reason, outside of Greenland and Antarctica, GIA corrections are based on Geruou et al. (2013) with the ICE6G ice history (Peltier et al., 2015).
To produce the plot, the following processing steps were performed:
- Data set created from file ['out_ts_filled_4_261_AIS.txt'] downloaded from [''] at ['2024-02-28 15:05:42']
- Zeroed series on June 2005 by subtracting the value for that month from all data values (see next entry)
- Added offset of -761.983 to all data values.
- Manually changed baseline to 2005-2005. Note that data values remain unchanged.
Page created on 2024-03-21 using climind v1.0

