Short Term Climate Drivers
Introduction
Climate modes are recurrent patterns, usually of pressure or sea-surface temperature (SST), typically characterized by negative and positive phases, which each have distinctive effects on the distribution of rainfall, temperature and other meteorological elements on time scales varying from days to seasons and beyond.
Key messages
Dataset and processing details
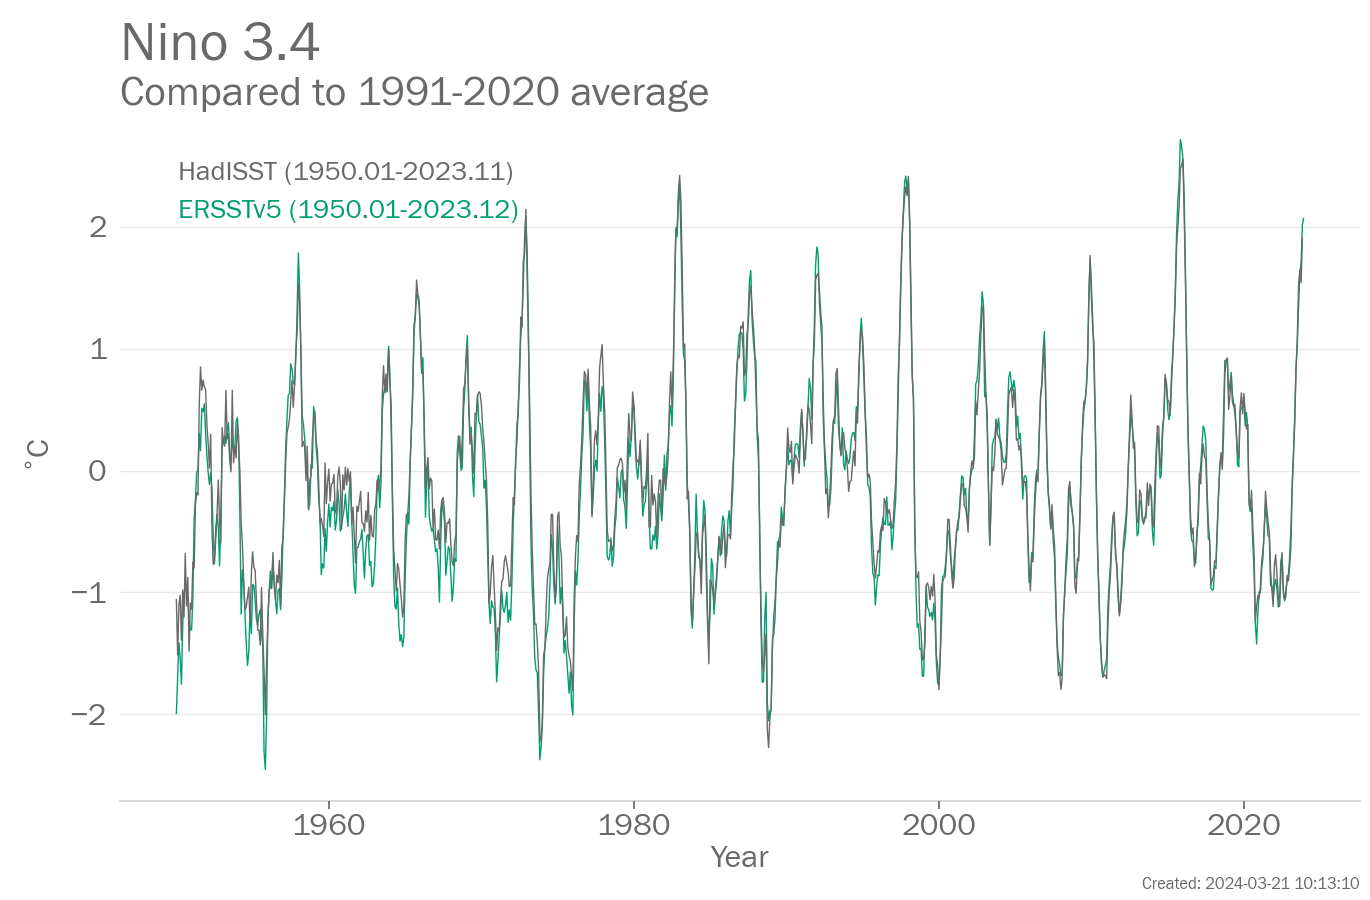
Nino 3.4
The data in the above plot are available in a zip file containing a csv file for each data set.
Data file: Nino_3.4_data_files.zip
Checksum: 2c89065a3942cef69ff4e4a74a664bbf
Format: BADC CSV format
ERSSTv5
Original data file (external link)
To produce the plot, the following processing steps were performed:
- Data set created from file ['nina34.data'] downloaded from ['https://psl.noaa.gov/data/correlation/nina34.data'] at ['2024-01-16 13:55:43']
- Rebaselined to 1991-2020 for each month separately by calculating the arithmetic mean of the data over the baseline period and subtracting the mean from all data values. This is done for each month separately (Januarys, Februarys etc).
- Selected years within the range 1950 to 2023.
HadISST
Original data file (external link)
To produce the plot, the following processing steps were performed:
- Data set created from file ['nino34.long.data'] downloaded from ['https://psl.noaa.gov/gcos_wgsp/Timeseries/Data/nino34.long.data'] at ['2024-01-16 13:55:44']
- Rebaselined to 1991-2020 for each month separately by calculating the arithmetic mean of the data over the baseline period and subtracting the mean from all data values. This is done for each month separately (Januarys, Februarys etc).
- Selected years within the range 1950 to 2023.
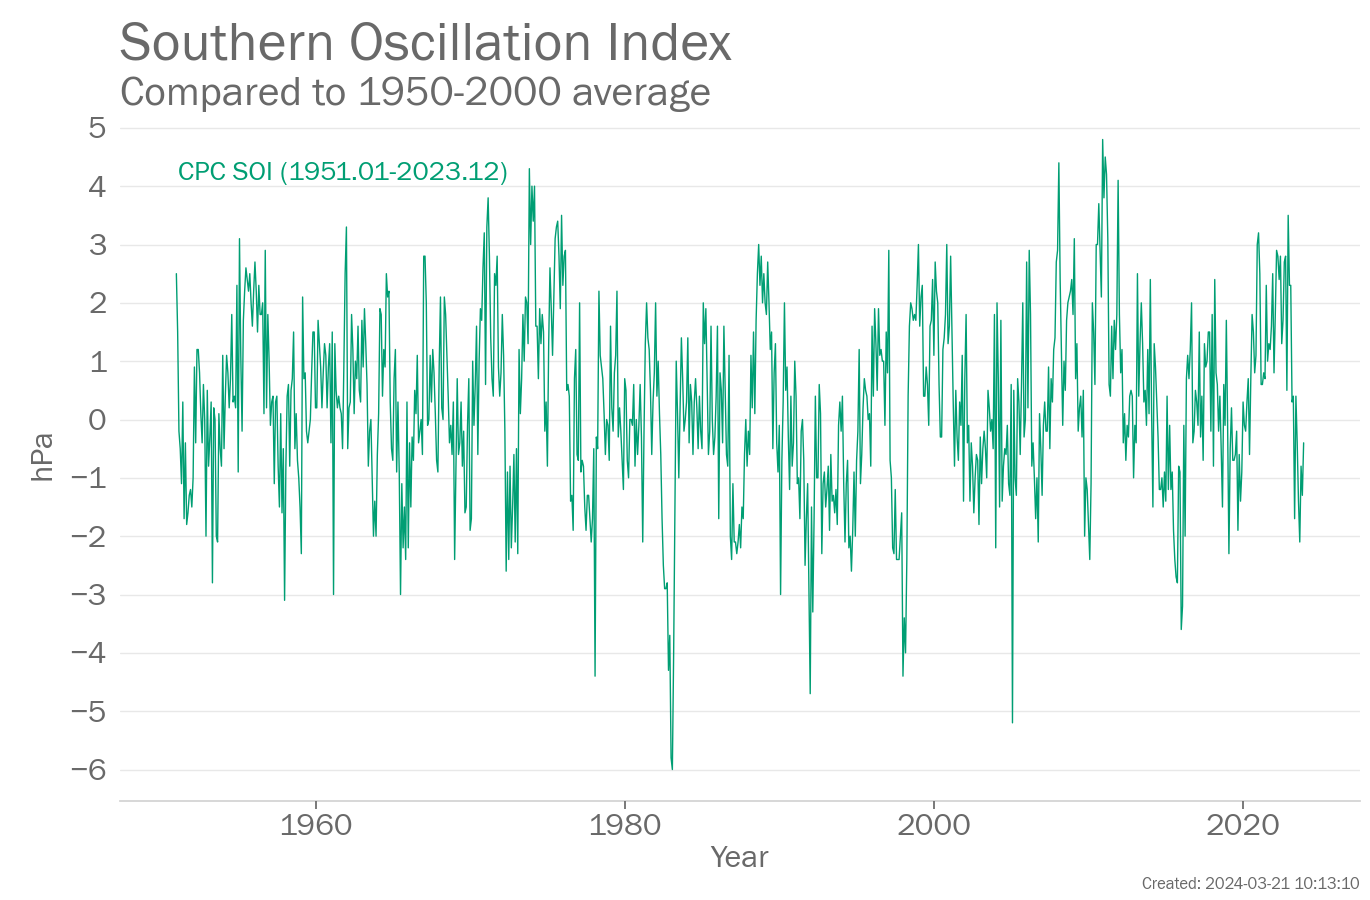
Southern Oscillation Index
The data in the above plot are available in a zip file containing a csv file for each data set.
Data file: Southern_Oscillation_Index_data_files.zip
Checksum: 94983d08655314beb7d50282bc40e41b
Format: BADC CSV format
CPC SOI
Original data file (external link)
To produce the plot, the following processing steps were performed:
- Data set created from file ['soi.data'] downloaded from ['https://psl.noaa.gov/data/correlation/soi.data'] at ['2024-01-16 13:55:44']
- Selected years within the range 1950 to 2023.
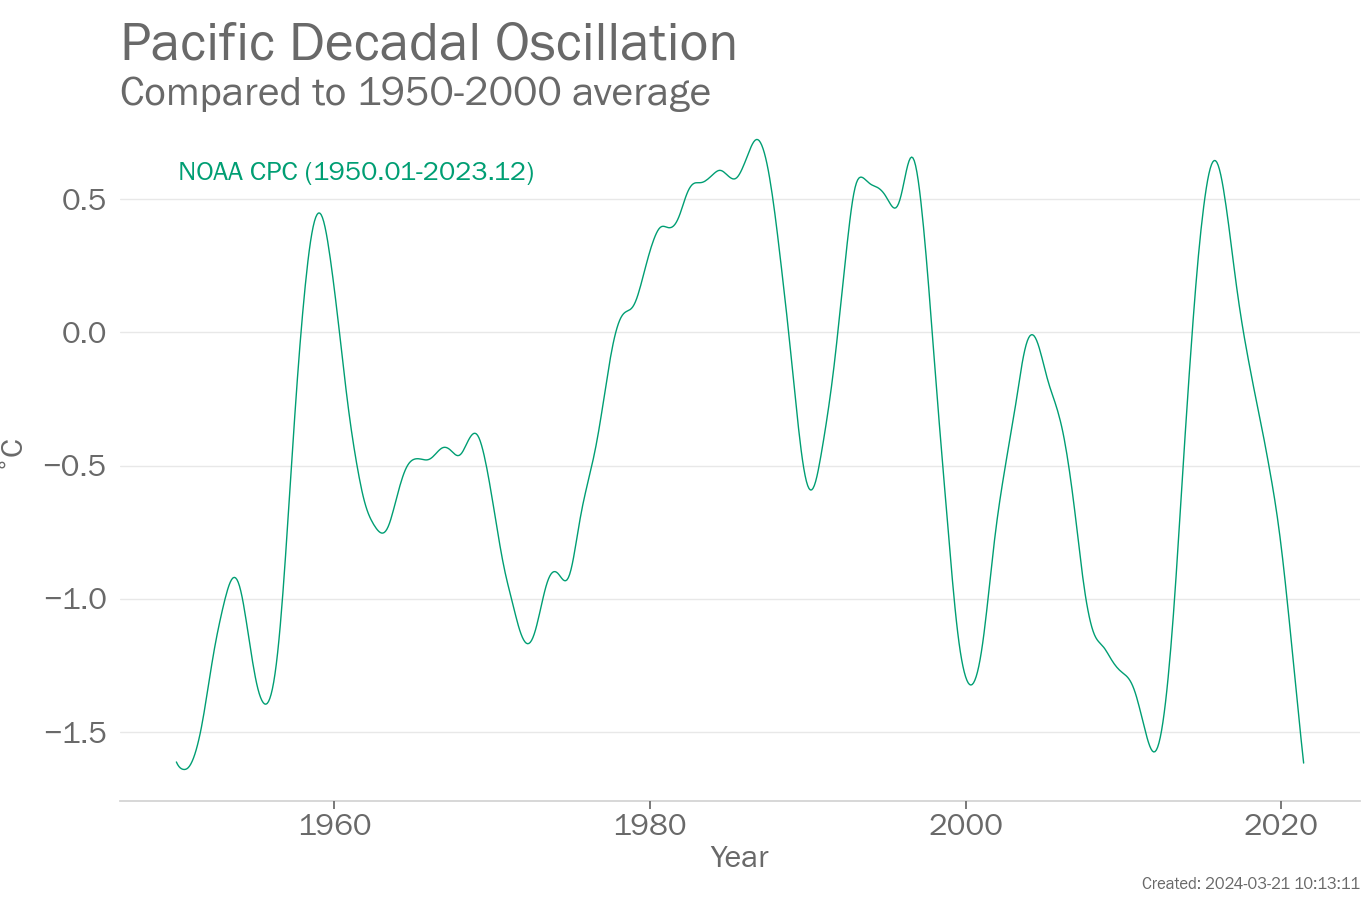
Pacific Decadal Oscillation
The data in the above plot are available in a zip file containing a csv file for each data set.
Data file: Pacific_Decadal_Oscillation_data_files.zip
Checksum: 54f73735debf5182188f0f8830a752f9
Format: BADC CSV format
NOAA CPC
Original data file (external link)
Citation:
To produce the plot, the following processing steps were performed:
- Data set created from file ['ersst.v5.pdo.dat'] downloaded from ['https://www.ncei.noaa.gov/pub/data/cmb/ersst/v5/index/ersst.v5.pdo.dat'] at ['2024-01-16 13:55:42']
- Calculated lowess smoothed series with 0.029411764705882353 of data used for each fit
- Selected years within the range 1950 to 2023.
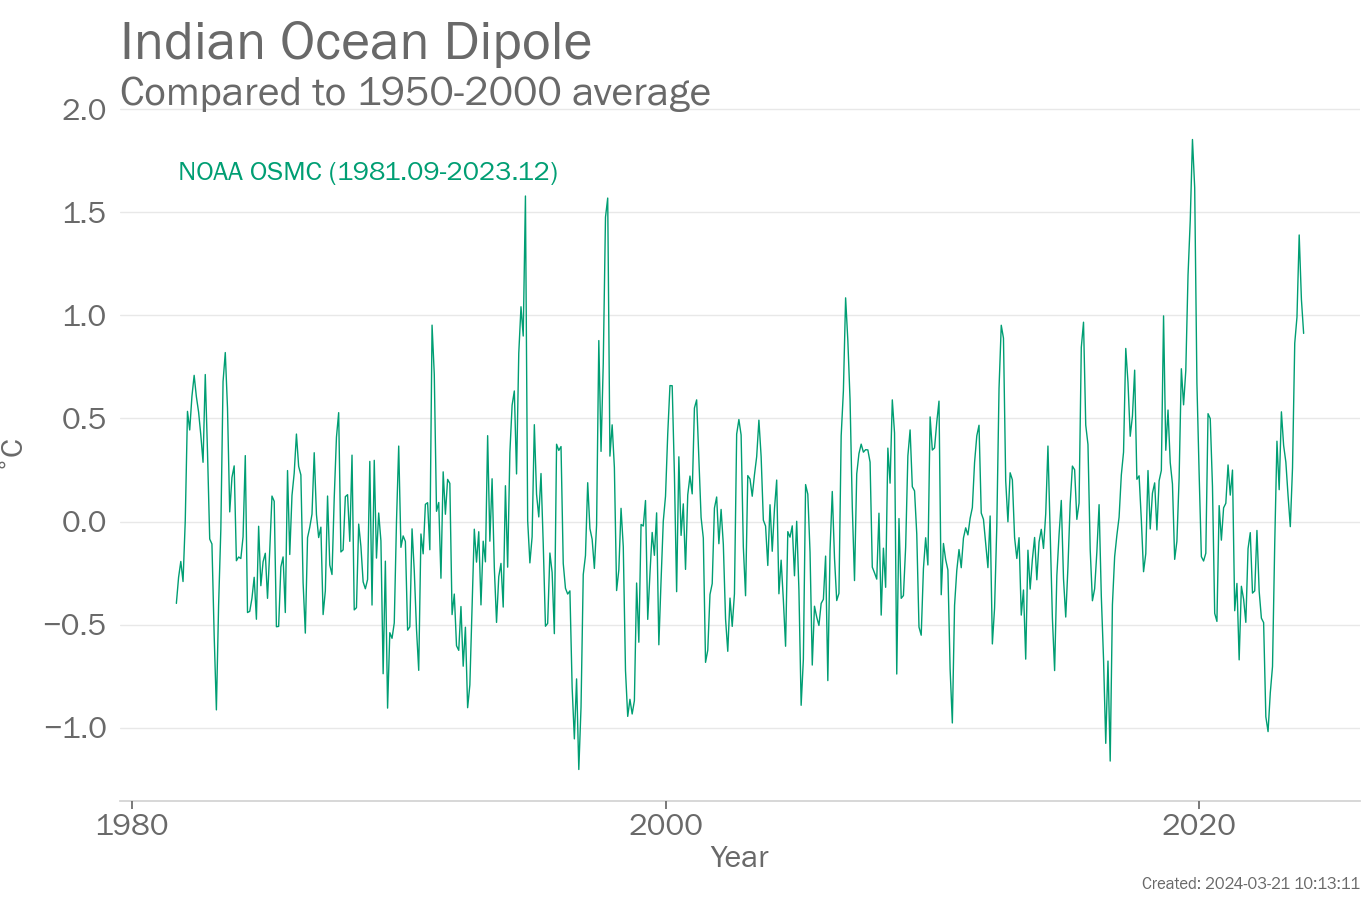
Indian Ocean Dipole
The data in the above plot are available in a zip file containing a csv file for each data set.
Data file: Indian_Ocean_Dipole_data_files.zip
Checksum: 6ac02013476a7dd03c7695db00e6107b
Format: BADC CSV format
NOAA OSMC
Original data file (external link)
To produce the plot, the following processing steps were performed:
- Data set created from file ['dmi.nc'] downloaded from ['https://stateoftheocean.osmc.noaa.gov/sur/data/dmi.nc'] at ['2024-01-25 17:32:12']
- Calculated monthly average from values using arithmetic mean of all dates that fall within each month
- Selected years within the range 1980 to 2023.
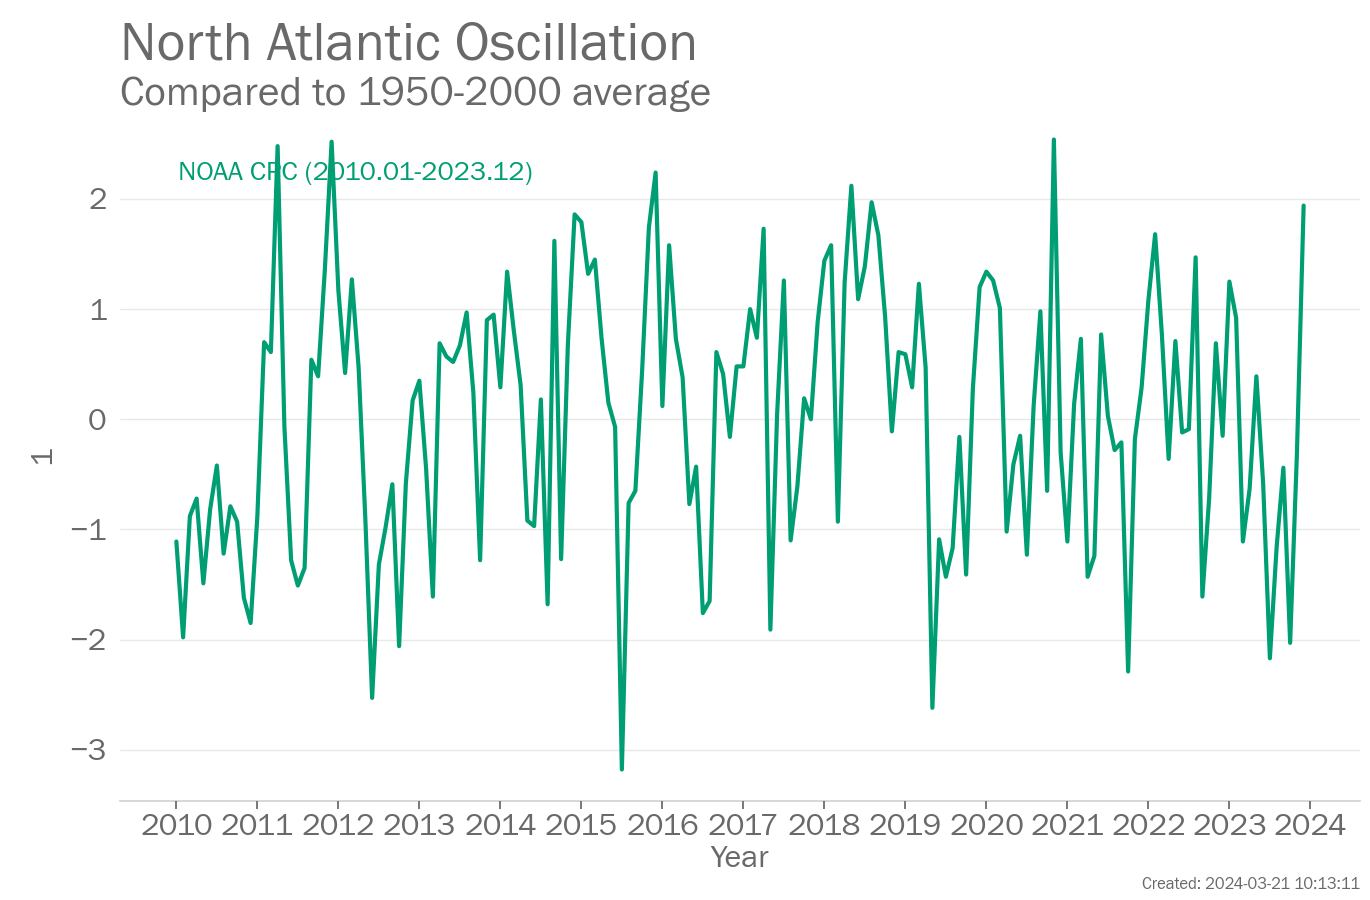
North Atlantic Oscillation
The data in the above plot are available in a zip file containing a csv file for each data set.
Data file: North_Atlantic_Oscillation_data_files.zip
Checksum: a3185157de67f9a47d9dca967e22c336
Format: BADC CSV format
NOAA CPC
Original data file (external link)
Citation:
To produce the plot, the following processing steps were performed:
- Data set created from file ['norm.nao.monthly.b5001.current.ascii.table'] downloaded from ['https://www.cpc.ncep.noaa.gov/products/precip/CWlink/pna/norm.nao.monthly.b5001.current.ascii.table'] at ['2024-01-16 13:55:41']
- Selected years within the range 2010 to 2023.
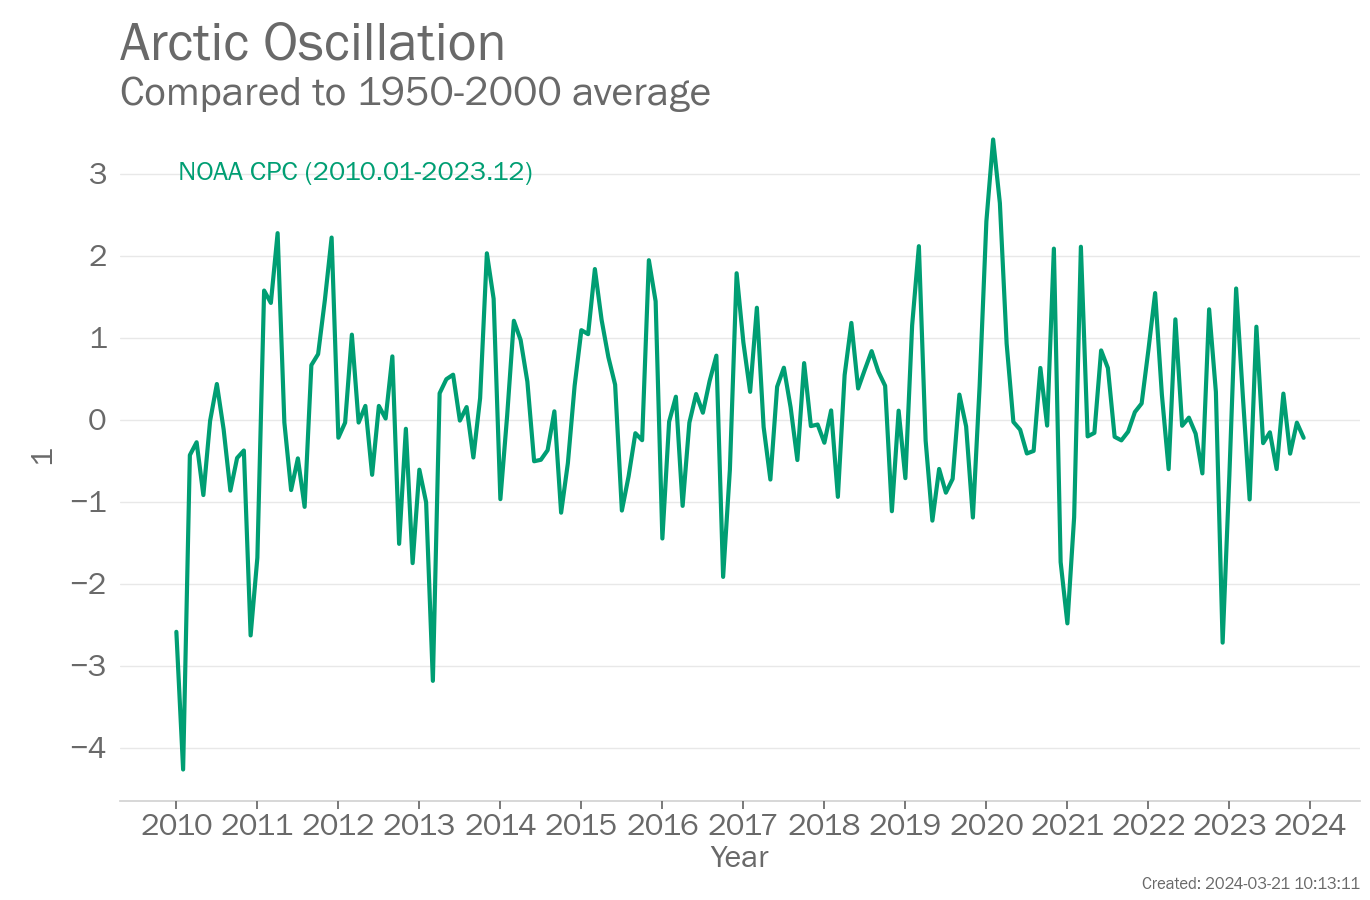
Arctic Oscillation
The data in the above plot are available in a zip file containing a csv file for each data set.
Data file: Arctic_Oscillation_data_files.zip
Checksum: e7d423c10ae0b56a7952862cc74b1b58
Format: BADC CSV format
NOAA CPC
Original data file (external link)
Citation:
To produce the plot, the following processing steps were performed:
- Data set created from file ['monthly.ao.index.b50.current.ascii.table'] downloaded from ['https://www.cpc.ncep.noaa.gov/products/precip/CWlink/daily_ao_index/monthly.ao.index.b50.current.ascii.table'] at ['2024-01-16 13:55:40']
- Selected years within the range 2010 to 2023.
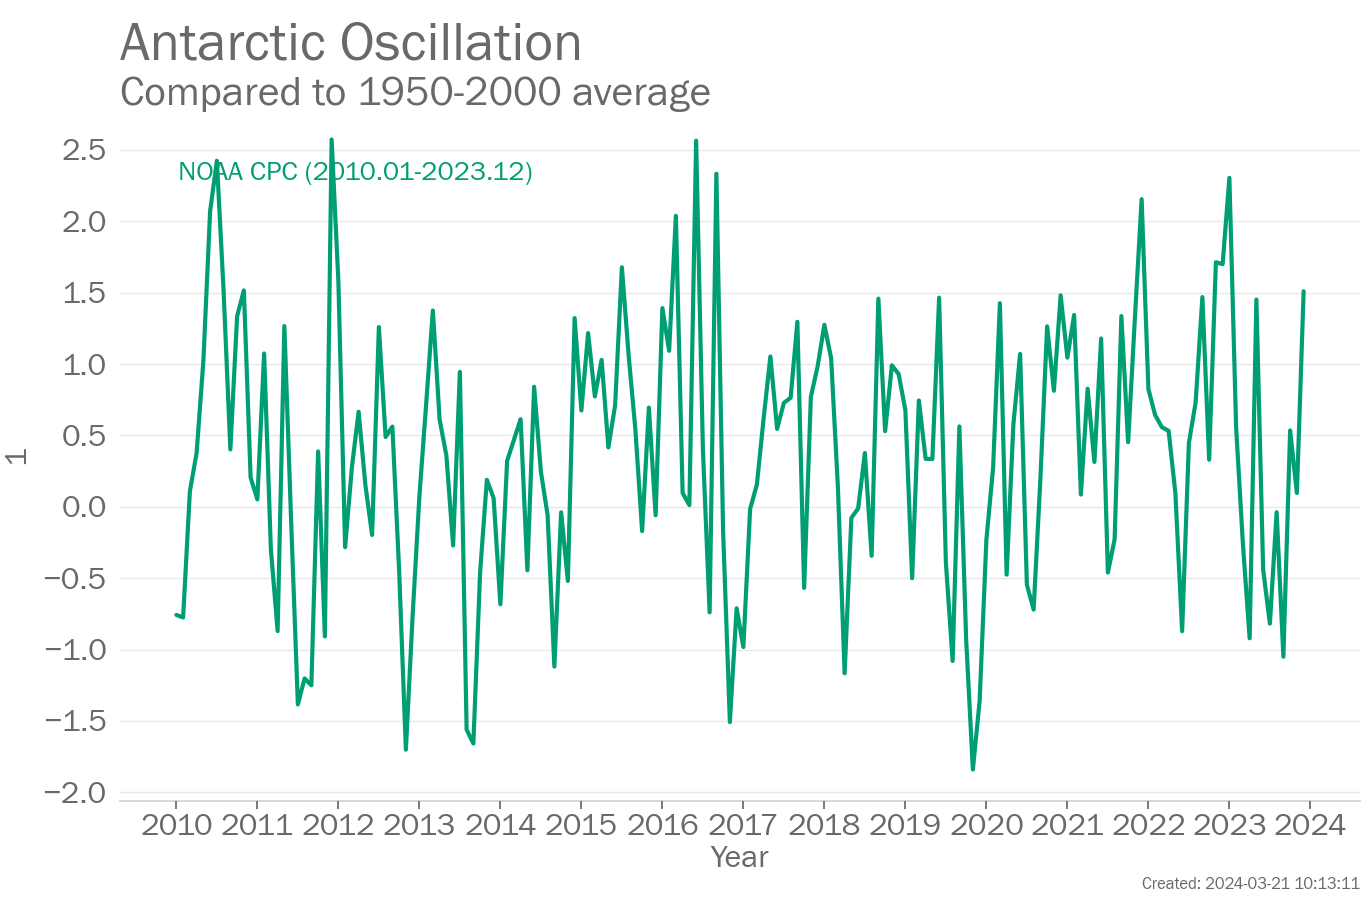
Antarctic Oscillation
The data in the above plot are available in a zip file containing a csv file for each data set.
Data file: Antarctic_Oscillation_data_files.zip
Checksum: 3c73884ba1342ff1f9360a263732abe5
Format: BADC CSV format
NOAA CPC
Original data file (external link)
Citation:
To produce the plot, the following processing steps were performed:
- Data set created from file ['monthly.aao.index.b79.current.ascii.table'] downloaded from ['https://www.cpc.ncep.noaa.gov/products/precip/CWlink/daily_ao_index/aao/monthly.aao.index.b79.current.ascii.table'] at ['2024-01-16 13:55:40']
- Selected years within the range 2010 to 2023.
Page created on 2024-03-21 using climind v1.0
