Greenhouse gases
Introduction
Greenhouse gases are gases such as Carbon Dioxide (CO2) and Methane (CH4) that absorb and re-emit infrared radiation. In the atmosphere, their interaction with infrared radiation ultimately leads to a warming of the atmosphere and surface.
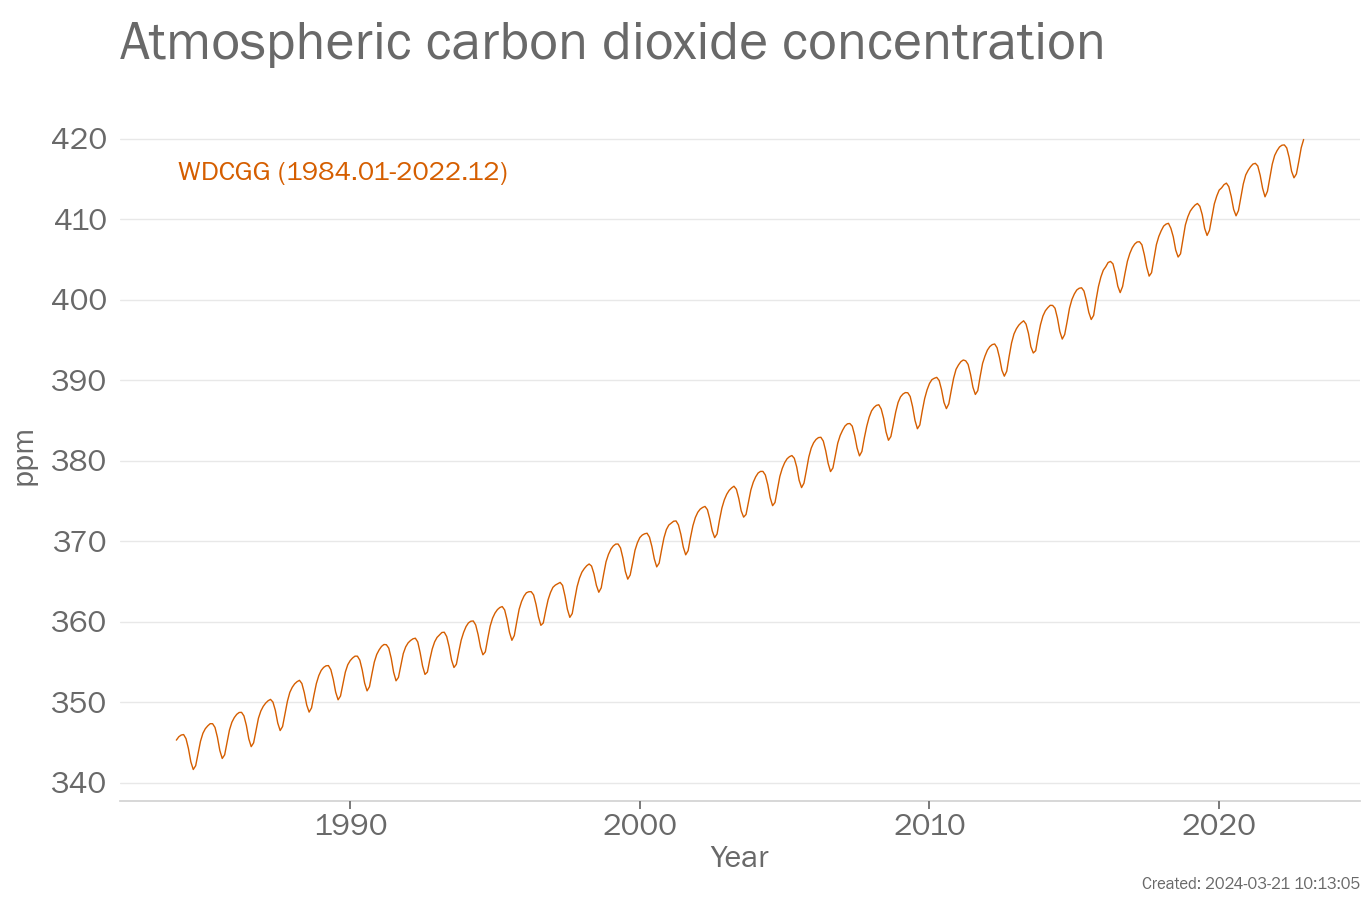
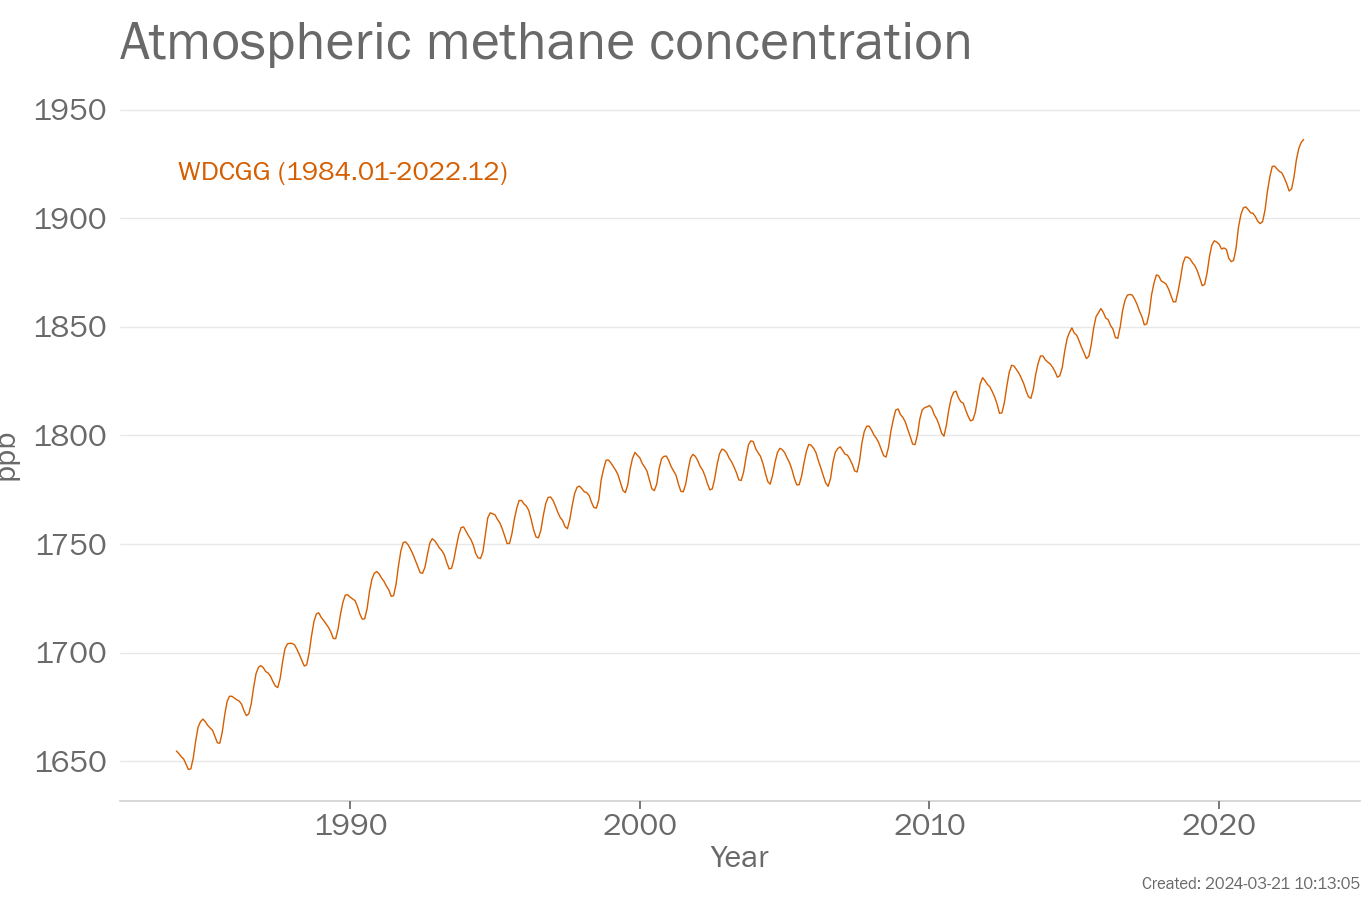
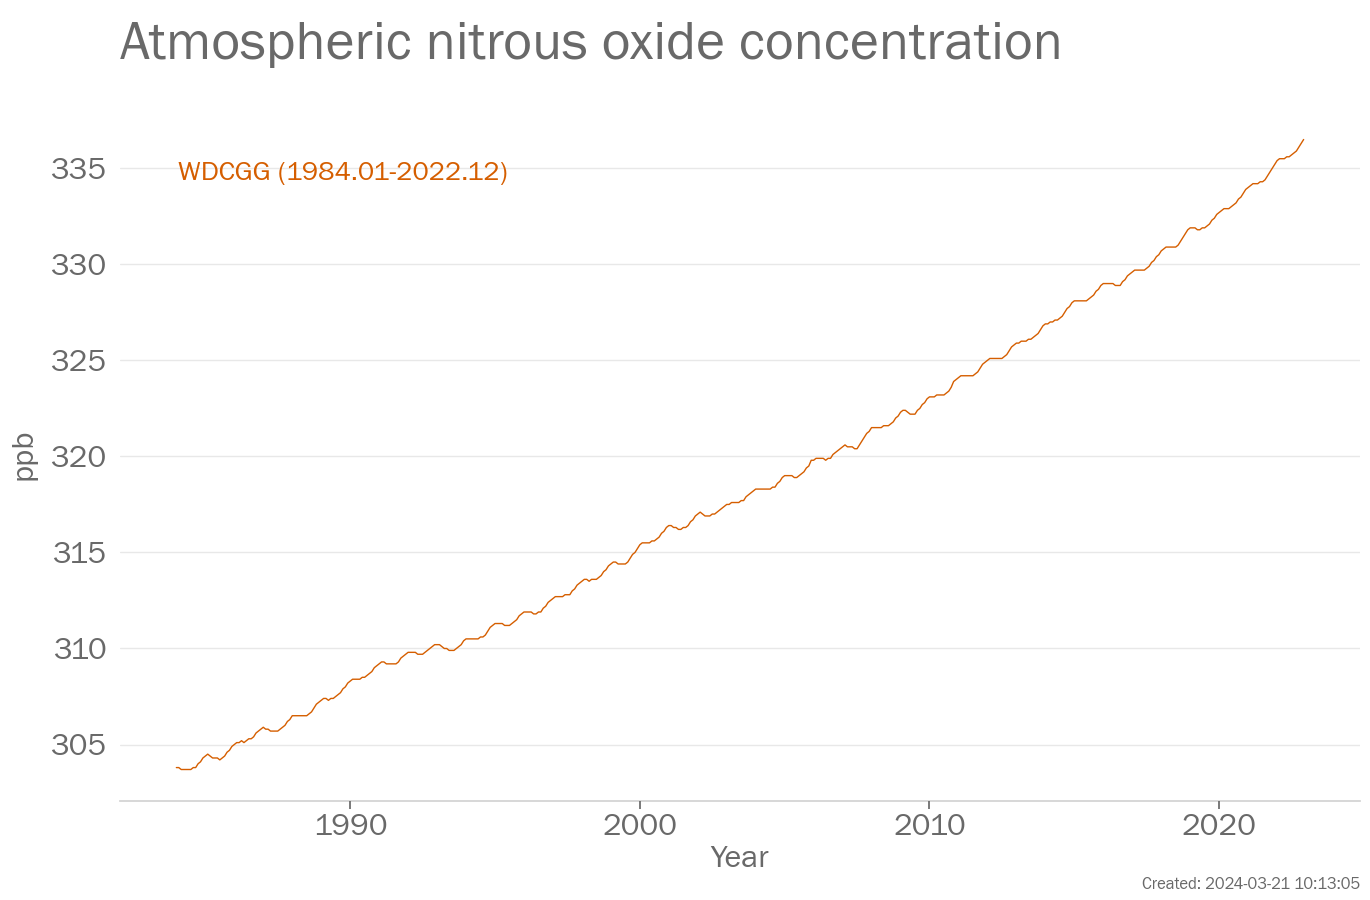
Atmospheric concentrations of greenhouse gases reflect a balance between emissions from human activities (such as the burning of fossil fuels), natural sources, and sinks in the biosphere and ocean. Increasing levels of greenhouse gases in the atmosphere due to human activities have been the major driver of climate change since the mid-twentieth century. Global average mole fractions of greenhouse gases (as shown in the figures) are calculated from in situ observations made at multiple sites in the Global Atmosphere Watch (GAW) Programme of WMO and partner networks.
The ocean is a sink for CO2. Some of the excess CO2 in the atmosphere is absorbed by the ocean. CO2 reacts with seawater and lowers its pH. This process is known as ocean acidification.
What the IPCC says
A 1.1 Observed increases in well-mixed greenhouse gas (GHG) concentrations since around 1750 are unequivocally caused by human activities. Since 2011 (measurements reported in AR5), concentrations have continued to increase in the atmosphere, reaching annual averages of 410 parts per million (ppm) for carbon dioxide (CO2), 1866 parts per billion (ppb) for methane (CH4), and 332 ppb for nitrous oxide (N2O) in 2019. Land and ocean have taken up a near-constant proportion (globally about 56% per year) of CO2 emissions from human activities over the past six decades, with regional differences (high confidence).
Key messages
Atmospheric concentration of carbon dioxide
In 2022, greenhouse gas mole fractions reached new highs, with globally averaged surface mole fractions of carbon dioxide (CO2) at 417.9 ± 0.2 parts per million (ppm), methane (CH4) at 1923 ± 2 parts per billion (ppb) and nitrous oxide (N2O) at 335.8 ± 0.1 ppb, respectively 150%, 264% and 124% of pre-industrial (1750) levels.
Paragraph updated: 2024-03-21 10:13
Dataset and processing details
Carbon dioxide
Carbon dioxide (CO2) is one of the most important greenhouse gases. The concentration of CO2 in the atmosphere is measured at stations around the world which are combined to provide a globally representative value.
The data in the above plot are available in a zip file containing a csv file for each data set.
Data file: Carbon_dioxide_data_files.zip
Checksum: b4f04d74dfdd9a0b26e102db0b0980a3
Format: BADC CSV format
WDCGG
Original data file (external link)
Citation:
To produce the plot, the following processing steps were performed:
- Data set created from file ['co2_monthly_20231115.csv'] downloaded from ['https://gaw.kishou.go.jp/static/publications/global_mean_mole_fractions/2023/co2_monthly_20231115.csv'] at ['2023-11-15 19:33:52']
Methane
Methane (CH4) is an important greenhouse gas. The concentration of CH4 in the atmosphere is measured at stations around the world which are combined to provide a globally representative value.
The data in the above plot are available in a zip file containing a csv file for each data set.
Data file: Methane_data_files.zip
Checksum: be9cc7894242fc4a260cdb9625b172ca
Format: BADC CSV format
WDCGG
Original data file (external link)
Citation:
To produce the plot, the following processing steps were performed:
- Data set created from file ['ch4_monthly_20231115.csv'] downloaded from ['https://gaw.kishou.go.jp/static/publications/global_mean_mole_fractions/2023/ch4_monthly_20231115.csv'] at ['2023-11-15 19:33:47']
Nitrous Oxide
Nitrous oxide (N2O) is an important greenhouse gas. The concentration of N2O in the atmosphere is measured at stations around the world which are combined to provide a globally representative value.
The data in the above plot are available in a zip file containing a csv file for each data set.
Data file: Nitrous_Oxide_data_files.zip
Checksum: 0e91fe7bce337969221b355ccc5751c8
Format: BADC CSV format
WDCGG
Original data file (external link)
Citation:
To produce the plot, the following processing steps were performed:
- Data set created from file ['n2o_monthly_20231115.csv'] downloaded from ['https://gaw.kishou.go.jp/static/publications/global_mean_mole_fractions/2023/n2o_monthly_20231115.csv'] at ['2023-11-15 19:33:56']
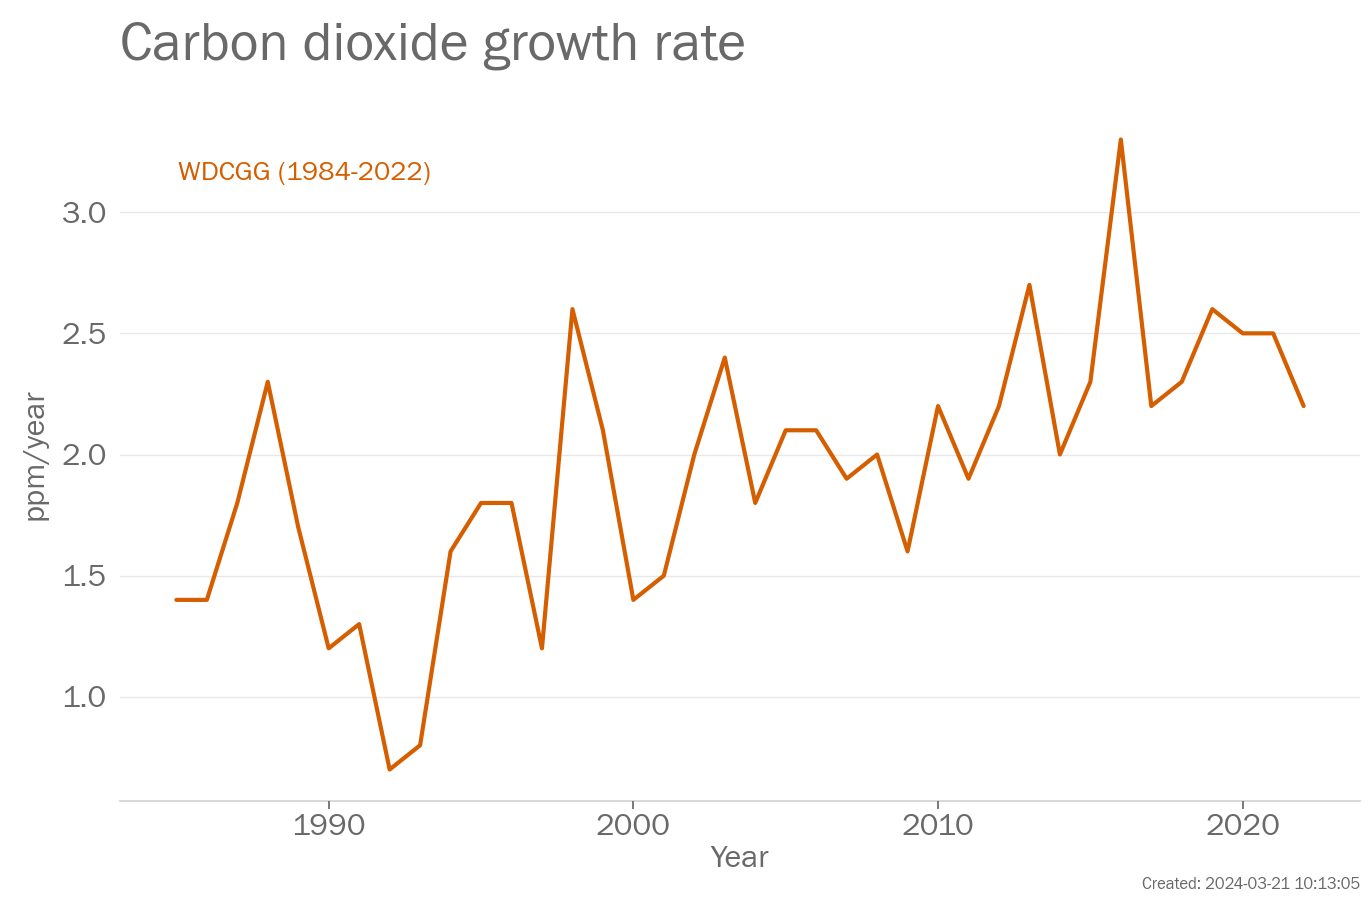
Carbon dioxide growth rate
The data in the above plot are available in a zip file containing a csv file for each data set.
Data file: Carbon_dioxide_growth_rate_data_files.zip
Checksum: 71d32fdf5841a58179d21dfb32d34045
Format: BADC CSV format
WDCGG
Original data file (external link)
Citation:
To produce the plot, the following processing steps were performed:
- Data set created from file ['co2_annual_20231115.csv'] downloaded from ['https://gaw.kishou.go.jp/static/publications/global_mean_mole_fractions/2023/co2_annual_20231115.csv'] at ['2023-11-15 19:33:55']
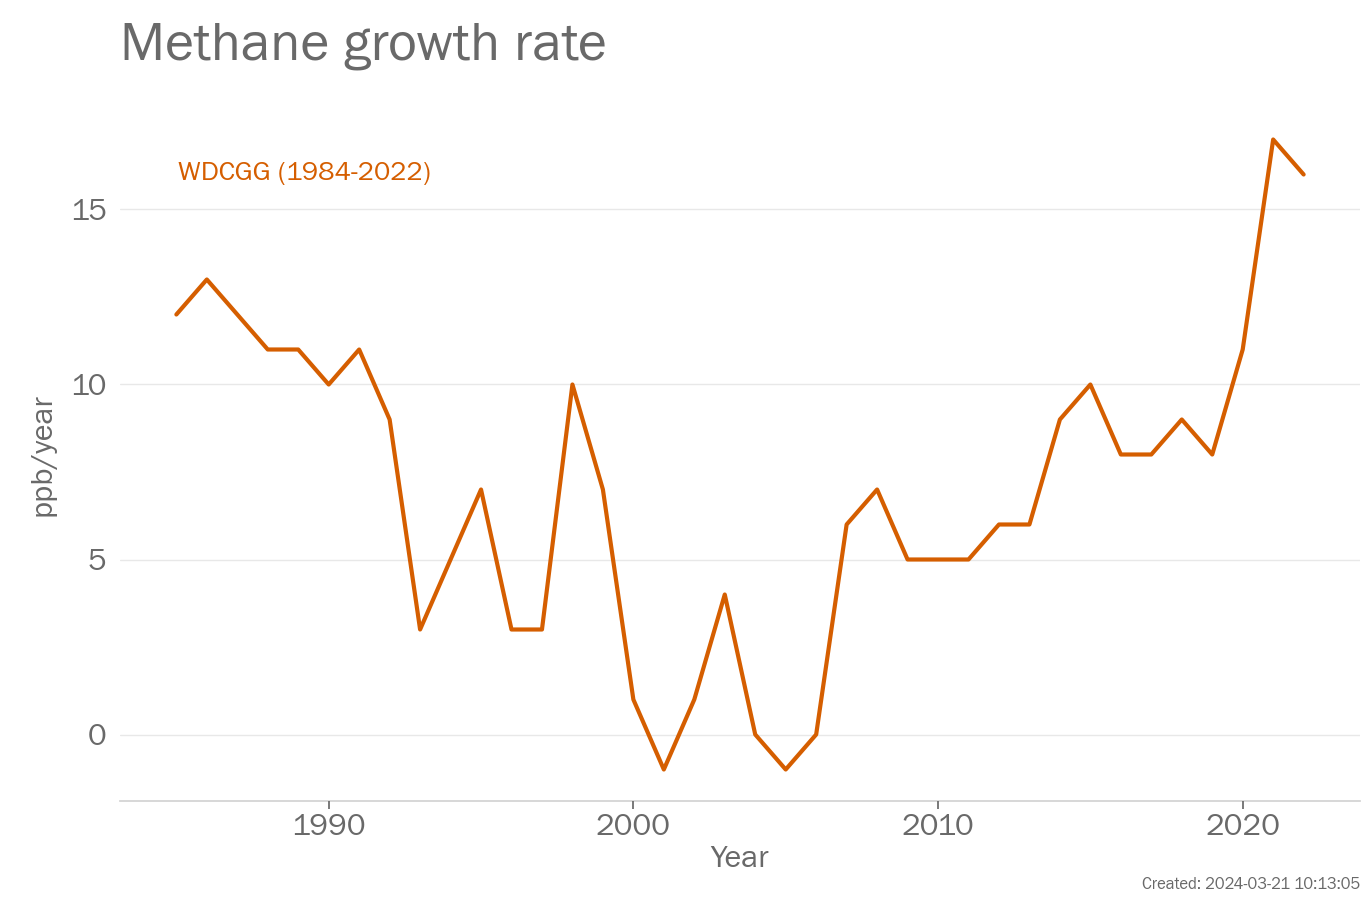
Methane growth rate
The data in the above plot are available in a zip file containing a csv file for each data set.
Data file: Methane_growth_rate_data_files.zip
Checksum: 97a74da0ca3688d713e7b80a6e8fb4a1
Format: BADC CSV format
WDCGG
Original data file (external link)
Citation:
To produce the plot, the following processing steps were performed:
- Data set created from file ['ch4_annual_20231115.csv'] downloaded from ['https://gaw.kishou.go.jp/static/publications/global_mean_mole_fractions/2023/ch4_annual_20231115.csv'] at ['2023-11-15 19:33:51']
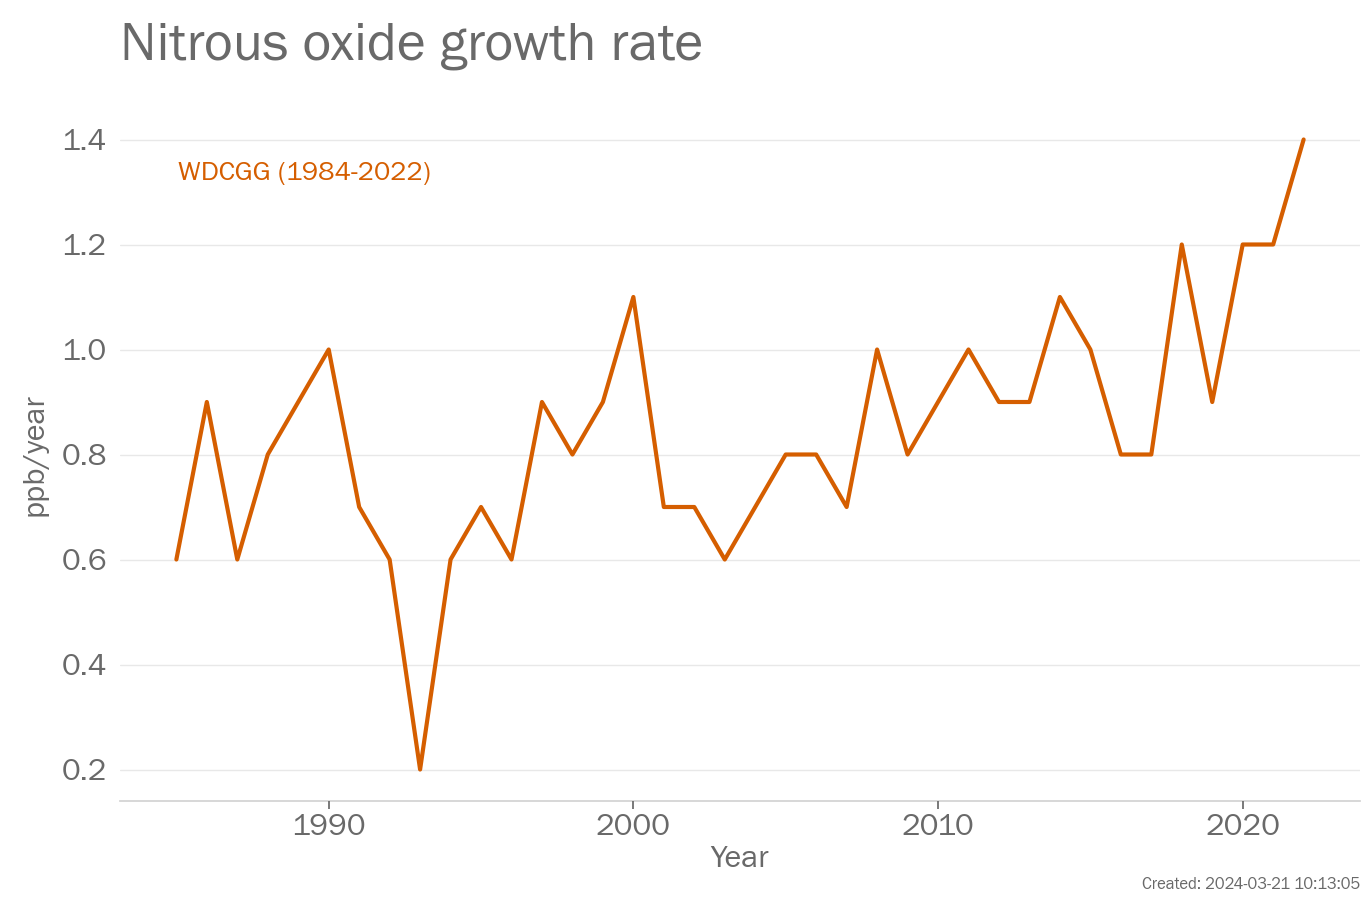
Nitrous oxide growth rate
The data in the above plot are available in a zip file containing a csv file for each data set.
Data file: Nitrous_oxide_growth_rate_data_files.zip
Checksum: ec3a9a41f653cba3c82c69fc7c8a70f1
Format: BADC CSV format
WDCGG
Original data file (external link)
Citation:
To produce the plot, the following processing steps were performed:
- Data set created from file ['n2o_annual_20231115.csv'] downloaded from ['https://gaw.kishou.go.jp/static/publications/global_mean_mole_fractions/2023/n2o_annual_20231115.csv'] at ['2023-11-15 19:33:59']
Page created on 2024-03-21 using climind v1.0
