Precipitation
Introduction
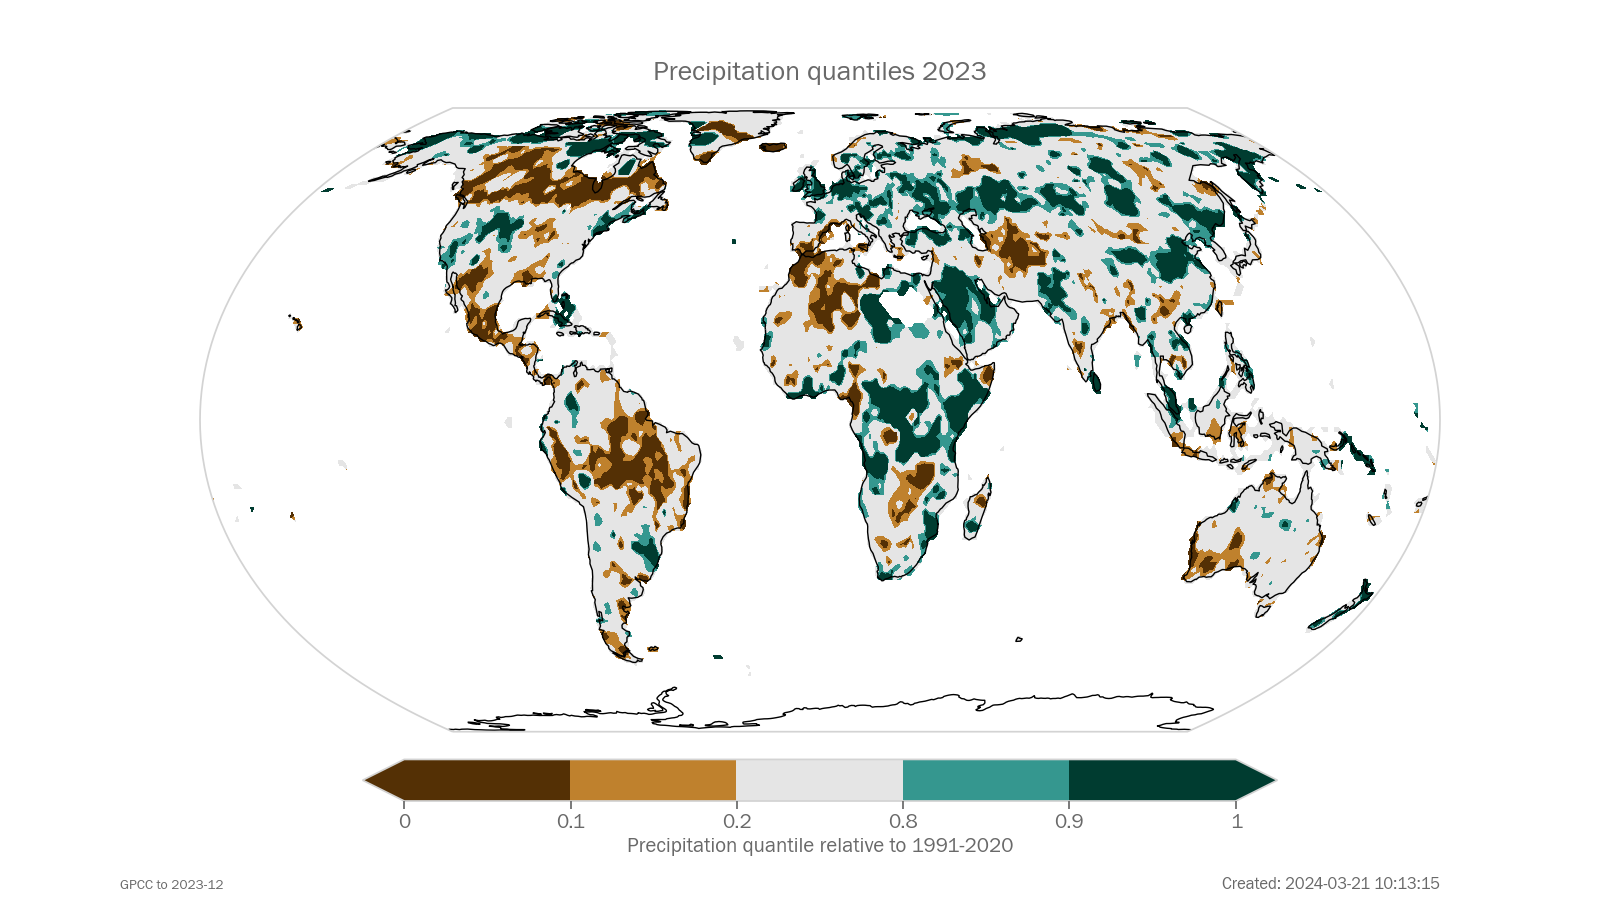
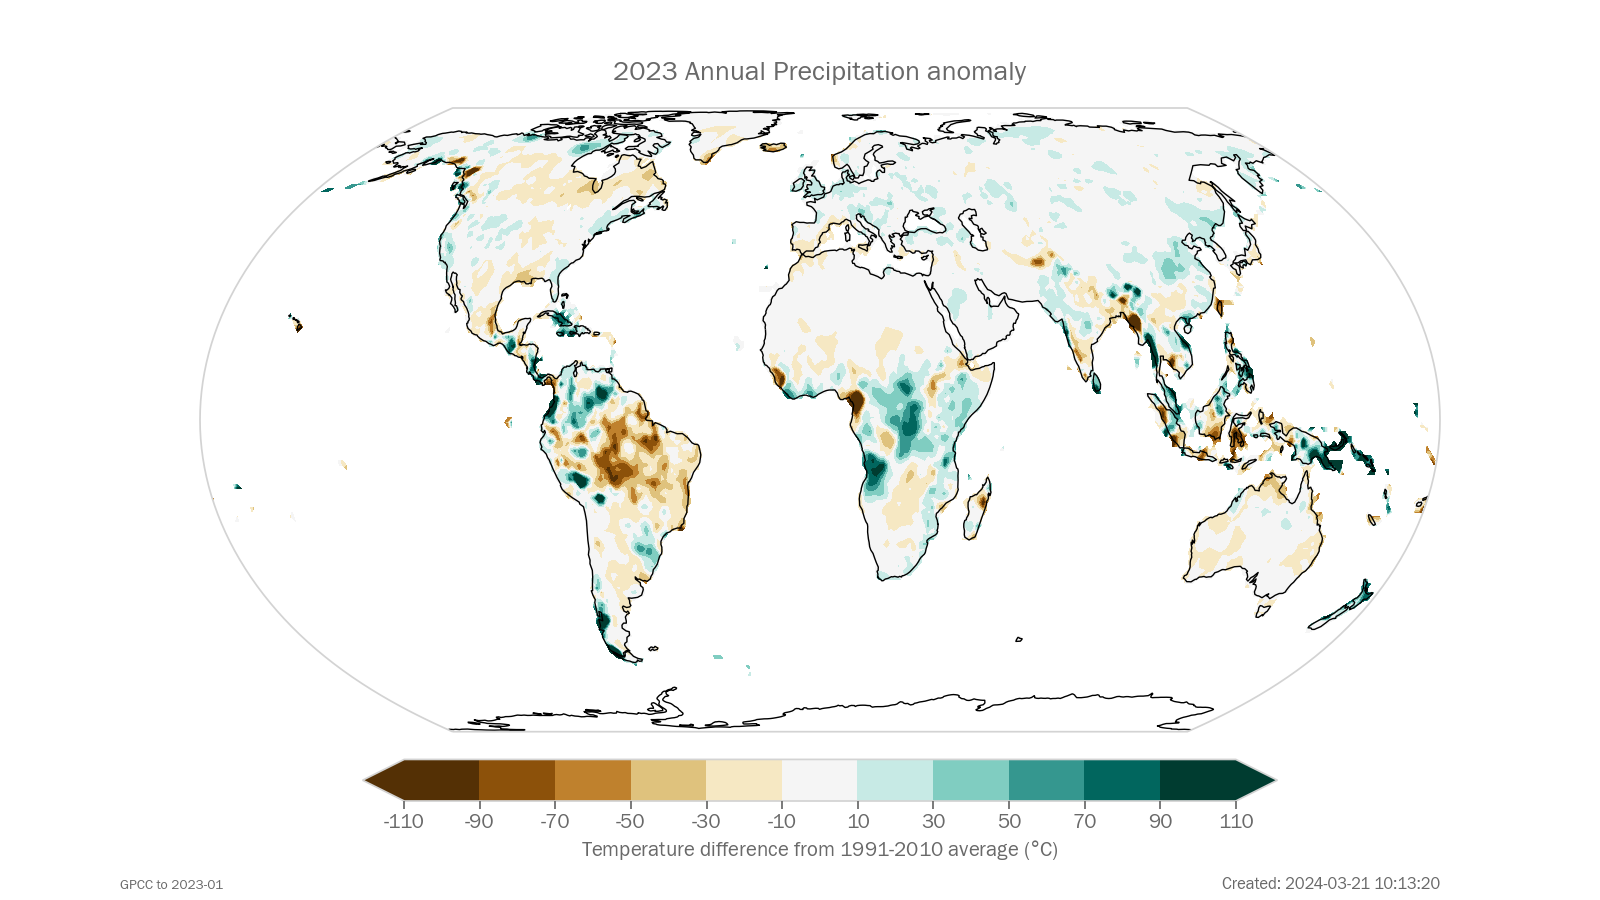
Precipitation includes rain, snow, sleet, and hail that falls to the ground. Too much or too little precipitation can have significant socioeconomic and environmental impacts and can lead to flooding and drought. Precipitation is measured at weather stations and rain gauges around the world. There is no single key global indicator associated with precipitation, but as local variations in precipitation are linked to local impacts, maps of precipitation quantiles (which categorise precipitation according to whether it is in the top 20% and 10% or lowest 20% and 10%) and anomalies (differences from the long-term average) are shown here. Global and regional patterns of rainfall are affected by short-term climate drivers such as the El Nino Southern Oscillation and the North Atlantic Oscillation.
What the IPCC says
A.1.4 Globally averaged precipitation over land has likely increased since 1950, with a faster rate of increase since the 1980s (medium confidence). It is likely that human influence contributed to the pattern of observed precipitation changes since the mid-20th century and extremely likely that human influence contributed to the pattern of observed changes in near-surface ocean salinity.
A.3.2 The frequency and intensity of heavy precipitation events has increased since the 1950s over most land area for which observational data are sufficient for trend analysis (high confidence), and human-induced climate change is likely the main driver. Human-induced climate change has contributed to increases in agricultural and ecological droughts in some regions due to increased land evapotranspiration (medium confidence).
Key messages
Precipitation
Accumulated precipitation totals in 2023 were above the long-term average in East and Central Asia and parts of northern Asia; the western Indian summer monsoon region; parts of the Maritime Continent; northern New Zealand; parts of West, Central, Southern and East Africa; West, Central and Southeast Europe; southern Scandinavia; the western Middle East; northwest, southwest and southeast North America; Greater Antilles; and parts of southeast South America.Regions with a marked rainfall deficit included: southeast South America, the Amazon Basin, and much of Central America; southern Canada; the western Mediterranean region and Southwest Europe; parts of northwest, central, and southern Africa; parts of central Asia; the eastern Indian Monsoon region; parts of southeast Asia and the Maritime Continent; southwest and coastal north Australia; and many of the Pacific Islands.The onset of the West African Monsoon was around normal. The start of the Gu rain season (April to June) in the Greater Horn of Africa brought unusually large rainfalls amounts in some areas.
Paragraph updated: 2024-03-21 10:13
Dataset and processing details
Precipitation
Precipitation quantiles are based on the twelve months aggregated GPCC Monitoring Product and First Guess Monthly product. The baseline period is 1991-2020, using Full Data Monthly in its latest version. Quality controlled rain gauge (in situ) data are used and the quality control protocol depends on the data set. The percentiles are not calculated for those grid cells, where the precipitation total aggregated in the reference period is below ten millimetres.
The data in the above plot are available in a zip file containing a csv file for each data set.
Data file: Precipitation_data_files.zip
Checksum: 76cdb2bad9582d23c1f6f4d868218d6c
Format: BADC CSV format
GPCC
Original data file (external link)
To produce the plot, the following processing steps were performed:
- Gridded dataset created from file ['gpcc_quantile_12month_*-YYYYMMMM.nc.gz'] downloaded from ['https://opendata.dwd.de/climate_environment/GPCC/GPCC_Quantile/Last12Month/gpcc_quantile_12month_*-YYYYMMMM.nc.gz']
- Selected single month 12/2023
Annual precipitation anomalies
The data in the above plot are available in a zip file containing a csv file for each data set.
Data file: Annual_precipitation_anomalies_data_files.zip
Checksum: 76cdb2bad9582d23c1f6f4d868218d6c
Format: BADC CSV format
GPCC
Original data file (external link) Original data file (external link) Original data file (external link) Original data file (external link)
To produce the plot, the following processing steps were performed:
- Gridded dataset created from file ['monitoring_v2022_10_YYYY_MMMM.nc.gz', 'first_guess_monthly_YYYY_MMMM.nc.gz', 'normals_1981_2010_v2022_10.nc.gz', 'normals_1991_2020_v2022_10.nc.gz'] downloaded from ['https://opendata.dwd.de/climate_environment/GPCC/monitoring_v2022/YYYY/monitoring_v2022_10_YYYY_MMMM.nc.gz', 'https://opendata.dwd.de/climate_environment/GPCC/first_guess/YYYY/first_guess_monthly_YYYY_MMMM.nc.gz', 'https://opendata.dwd.de/climate_environment/GPCC/gpcc_normals_v2022/normals_1981_2010_v2022_10.nc.gz', 'https://opendata.dwd.de/climate_environment/GPCC/gpcc_normals_v2022/normals_1991_2020_v2022_10.nc.gz']
- Selected period from 01/2023 to 12/2023
- Calculated time mean
Page created on 2024-03-21 using climind v1.0

